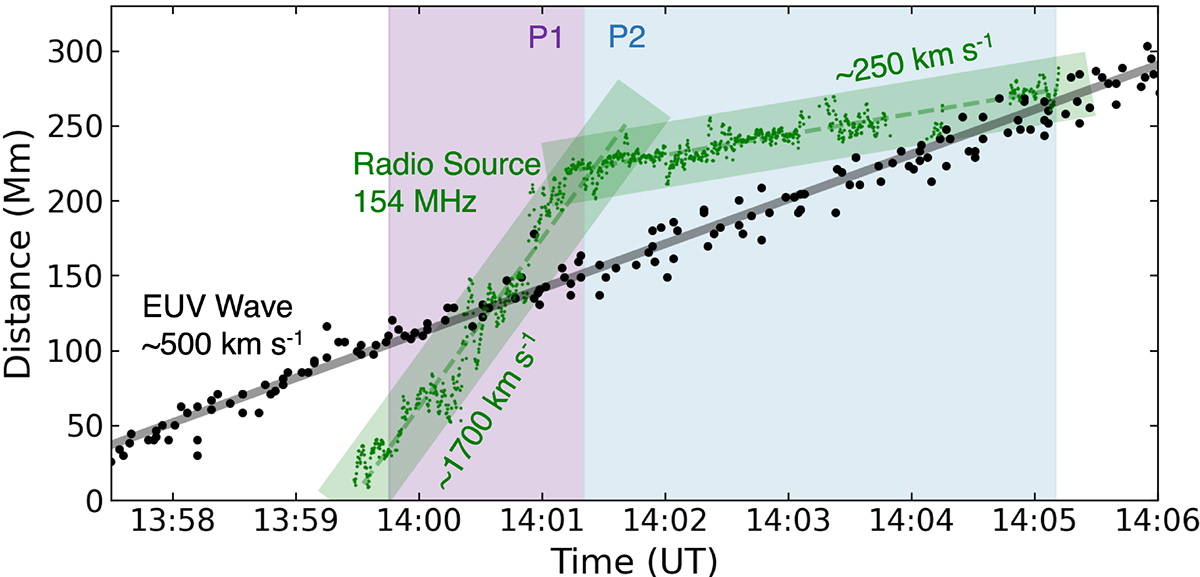
Fig. 3.
Download original image
Distance-time plot for CorPITA EUV wave (black points) and 0.25 s time resolution radio source (green points) with errors for each highlighted by shaded regions. The purple region (P1) highlights the region when the radio source initially travelled at a higher velocity, later slowing in the blue-shaded region (P2) once it reached the region of lower density. These correspond to the same emission marked in Fig. 2. The velocity of the EUV wave was 500 km s−1 and the radio source velocities were 1700 km s−1 and 250 km s−1.
Current usage metrics show cumulative count of Article Views (full-text article views including HTML views, PDF and ePub downloads, according to the available data) and Abstracts Views on Vision4Press platform.
Data correspond to usage on the plateform after 2015. The current usage metrics is available 48-96 hours after online publication and is updated daily on week days.
Initial download of the metrics may take a while.