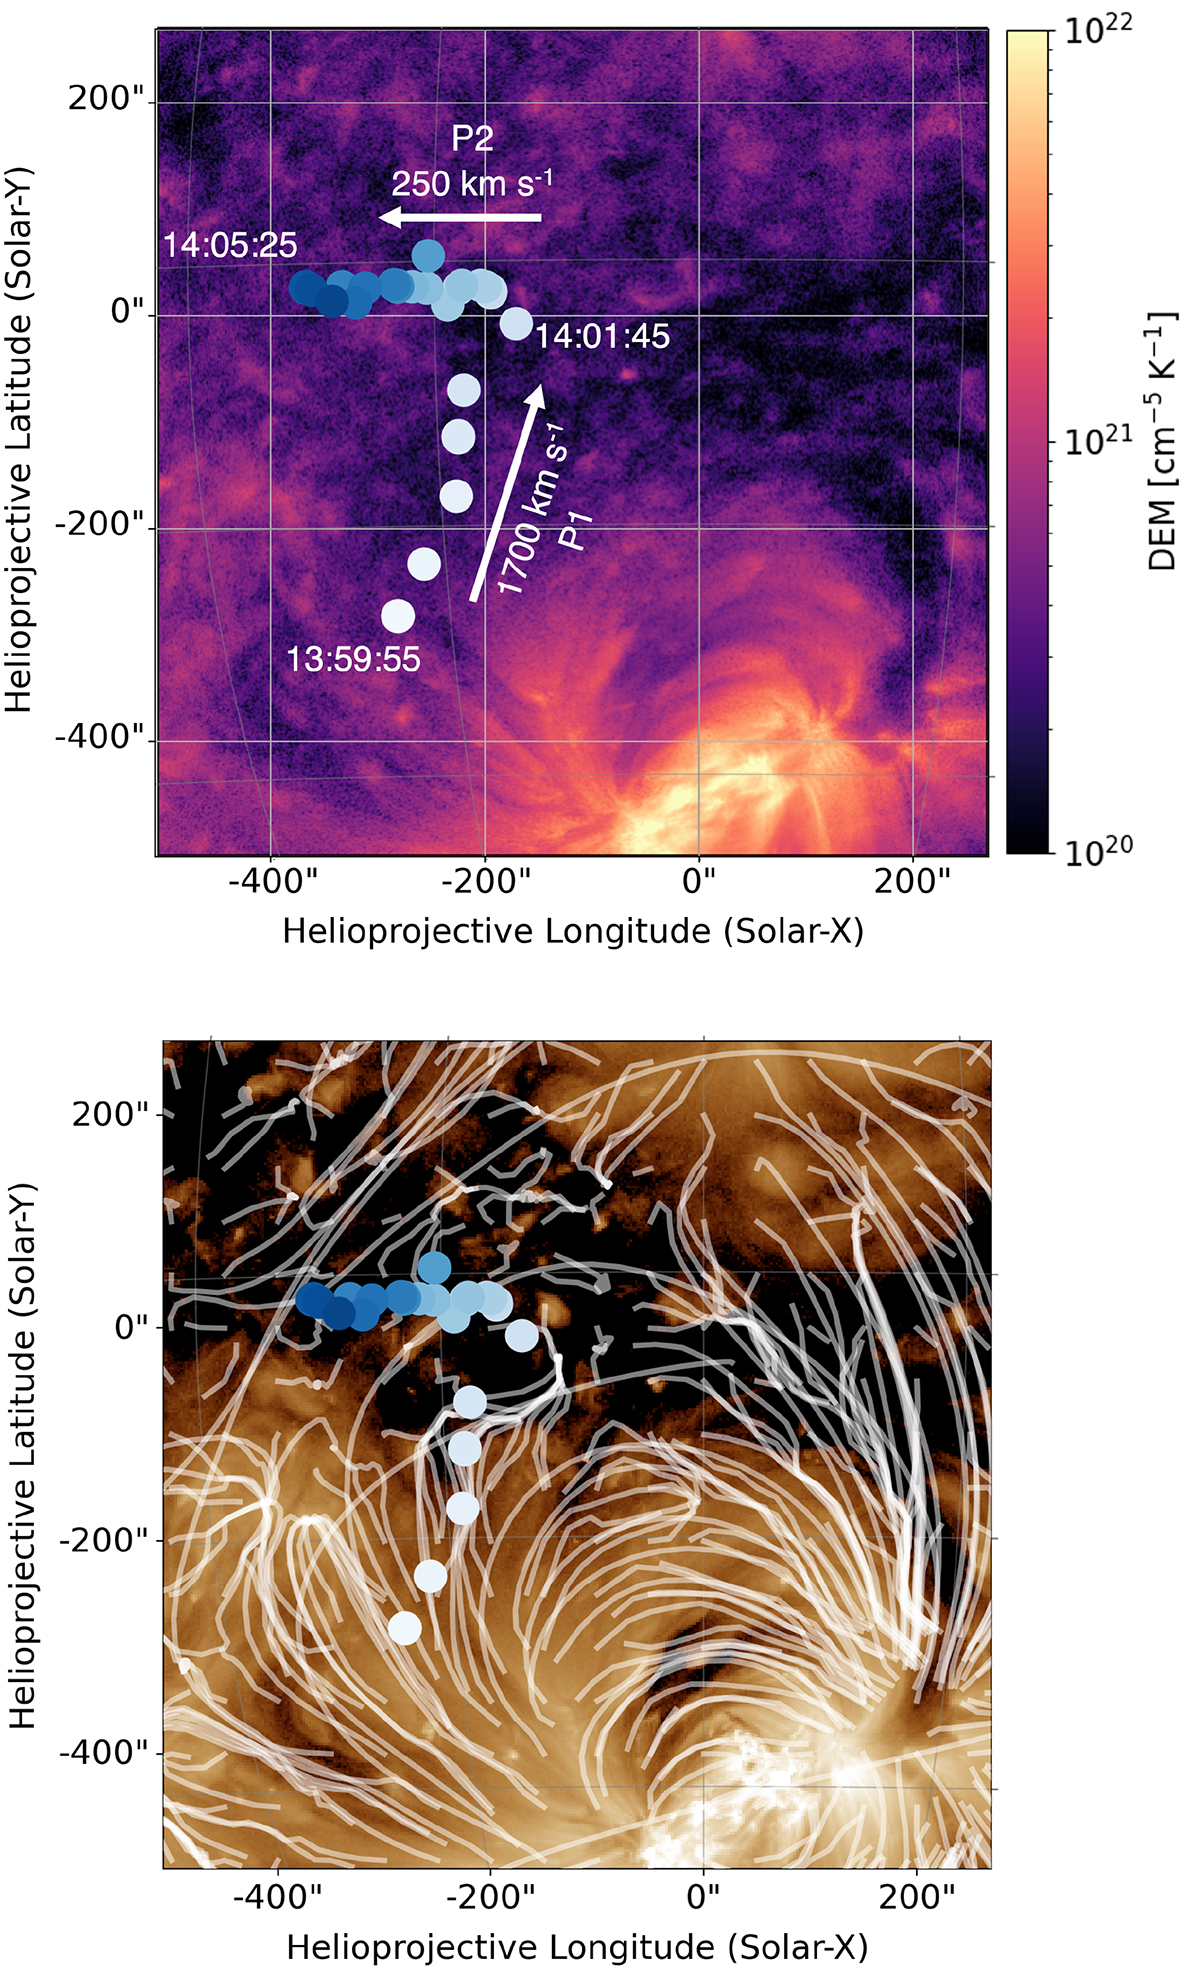
Fig. 2.
Download original image
Path of the 154 MHz radio source. (a): Line-of-sight-integrated DEM map. The white-to-blue points show the time evolution of the 154 MHz radio source in 10 s intervals. The velocities of the points in Phase 1 and Phase 2, obtained from 0.25 s data, are indicated by the labelled arrows. (b): Combination of an AIA 193 Å image during the event with a PFSS extrapolation. The radio emission clearly moves around a higher Alfvén speed region, favouring lower magnetic field strength regions.
Current usage metrics show cumulative count of Article Views (full-text article views including HTML views, PDF and ePub downloads, according to the available data) and Abstracts Views on Vision4Press platform.
Data correspond to usage on the plateform after 2015. The current usage metrics is available 48-96 hours after online publication and is updated daily on week days.
Initial download of the metrics may take a while.