Fig. 3
Download original image
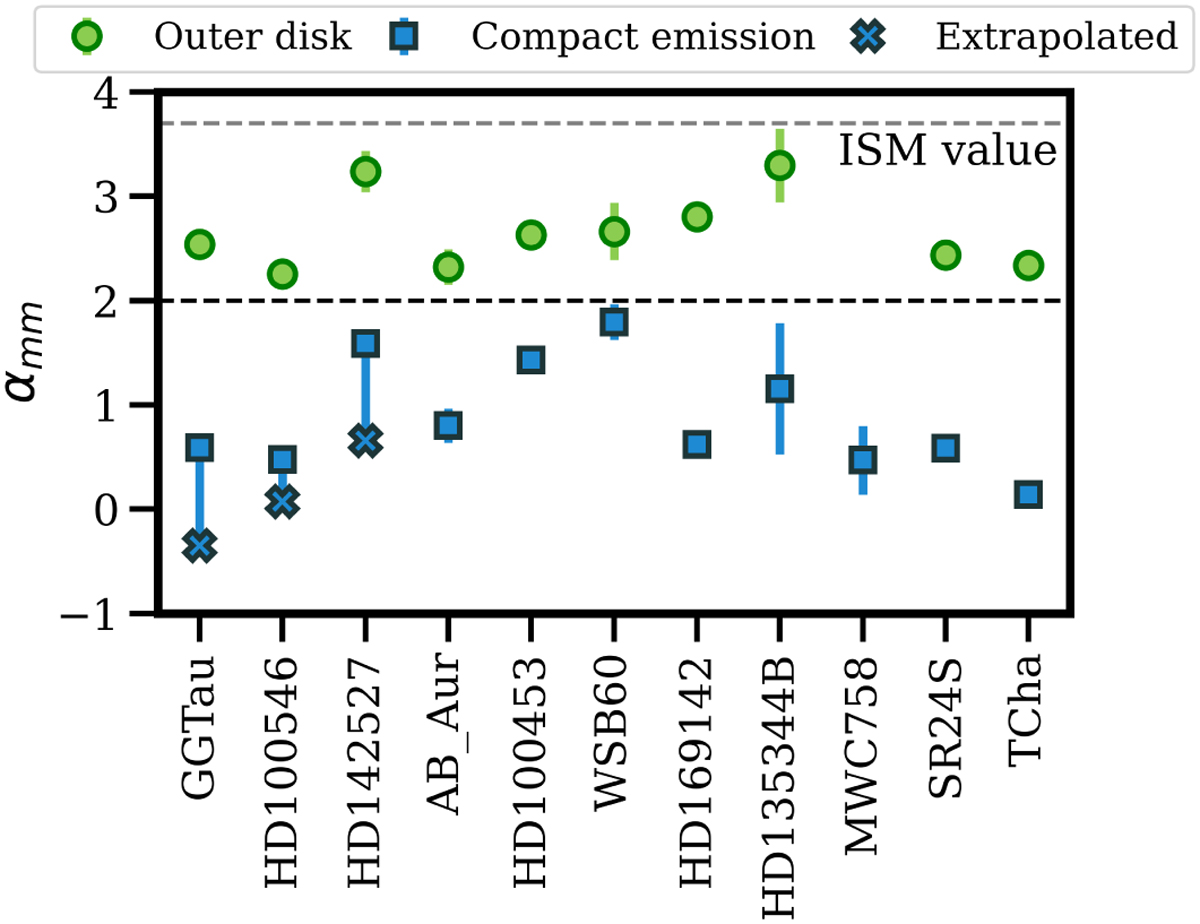
Spectral indices of the mm-wave emission. Green dots refer to the outer disk, while blue squares and red crosses refer to the central emission. For the first three targets – GGTau, HD 100546, and HD 142527 – the red crosses indicate αextrap, while the blue squares indicate α3 mm-cm (see text for further details). The dashed grey line shows the value of the spectral index in the ISM, α = 3.7, while the black line shows α = 2.
Current usage metrics show cumulative count of Article Views (full-text article views including HTML views, PDF and ePub downloads, according to the available data) and Abstracts Views on Vision4Press platform.
Data correspond to usage on the plateform after 2015. The current usage metrics is available 48-96 hours after online publication and is updated daily on week days.
Initial download of the metrics may take a while.