Fig. 2
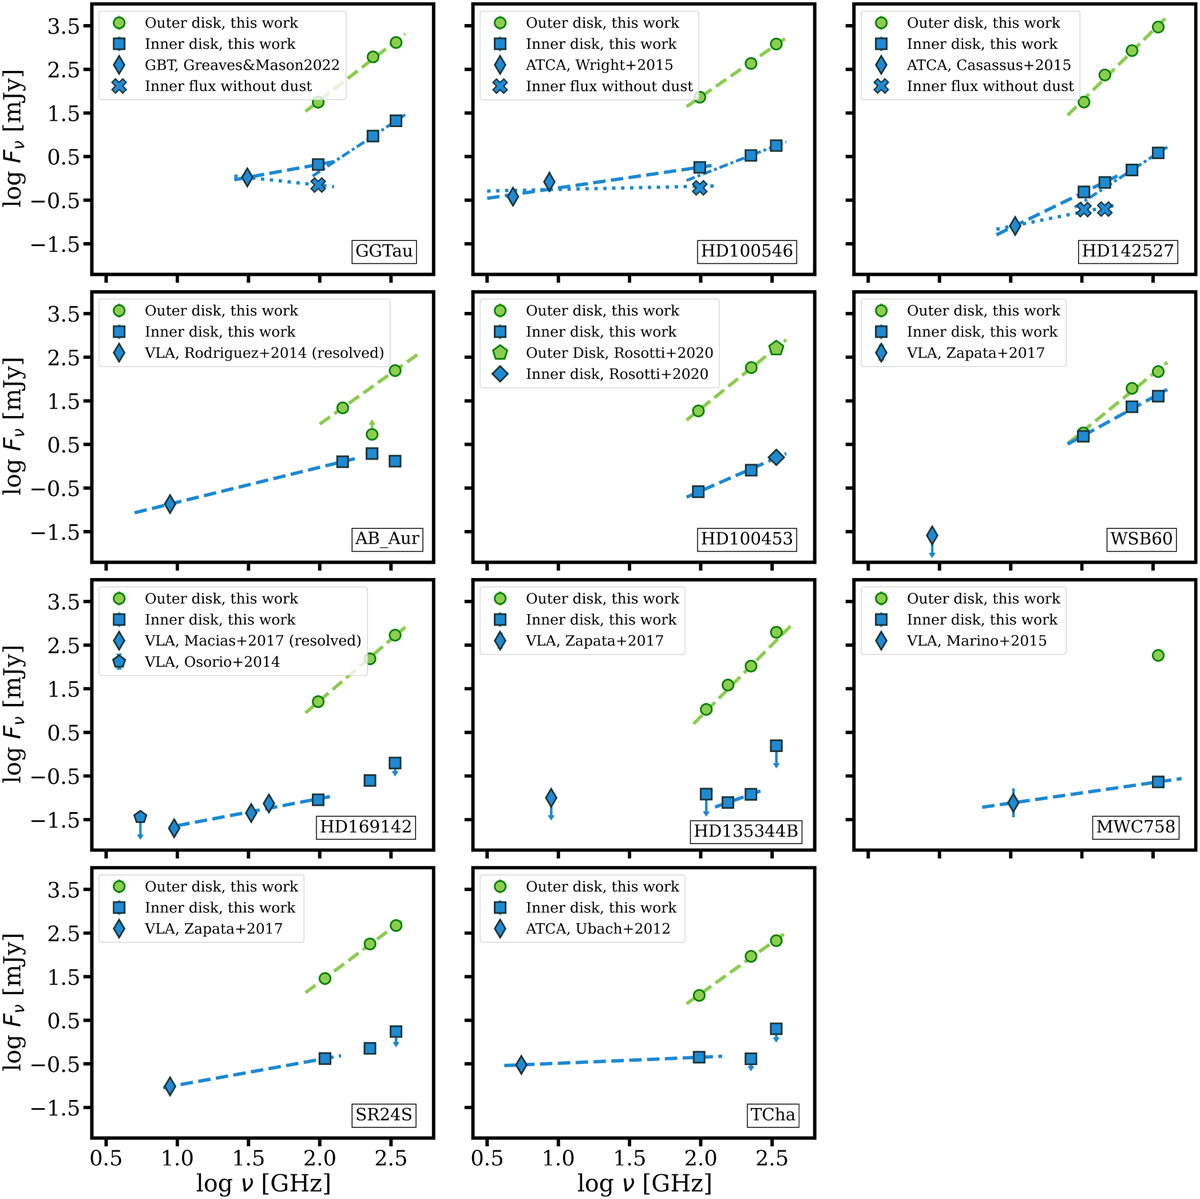
Download original image
SED of each disk in the sample. Green dots show the estimated fluxes at different wavelengths for the outer disk, while blue squares refer to the inner disk. As for the cm data from the literature, if the emission of the inner disk is resolved from the emission from the outer disk, the label “resolved” is added to the legend. The green lines show the best-fit for the outer disk. The blue lines refer to the inner disk emission. In particular, dash-dotted, dashed, and dotted blue lines in the first row refer to the best-fit between the 1 mm observations, the best-fit between the 3 mm and cm observations, and the best-fit between the 3 mm data without the dust contribution and the cm-data, respectively. The dashed blue lines in the second, third, and fourth rows show the best-fit between all the available data. See the text for further details.
Current usage metrics show cumulative count of Article Views (full-text article views including HTML views, PDF and ePub downloads, according to the available data) and Abstracts Views on Vision4Press platform.
Data correspond to usage on the plateform after 2015. The current usage metrics is available 48-96 hours after online publication and is updated daily on week days.
Initial download of the metrics may take a while.