Fig. A.10
Download original image
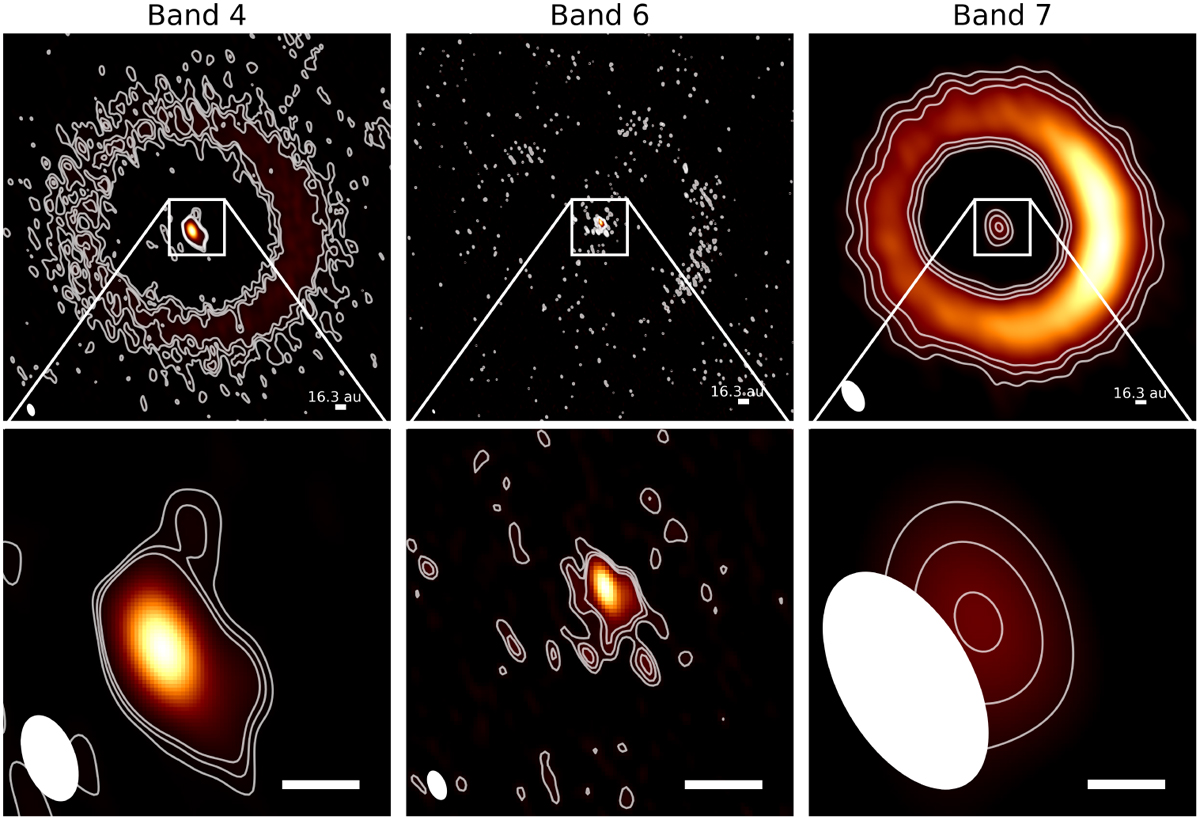
Intensity maps of the disk around AB Aur. The first, second, and third columns show the images of the disk in Band 4, Band 6, and Band 7, respectively. The images in the first row are 3″.5 × 3″.5, while the zooms in the second row are 0″.5 × 0″.5. In each image, the color scale has the peak flux as the maximum, and the image rms as minimum. All bars in the bottom right are 0″.1 in length, which is ~16.3 au at the distance of the source. White contours show three, five, and seven times the rms of the continuum emission.
Current usage metrics show cumulative count of Article Views (full-text article views including HTML views, PDF and ePub downloads, according to the available data) and Abstracts Views on Vision4Press platform.
Data correspond to usage on the plateform after 2015. The current usage metrics is available 48-96 hours after online publication and is updated daily on week days.
Initial download of the metrics may take a while.