Fig. 4
Download original image
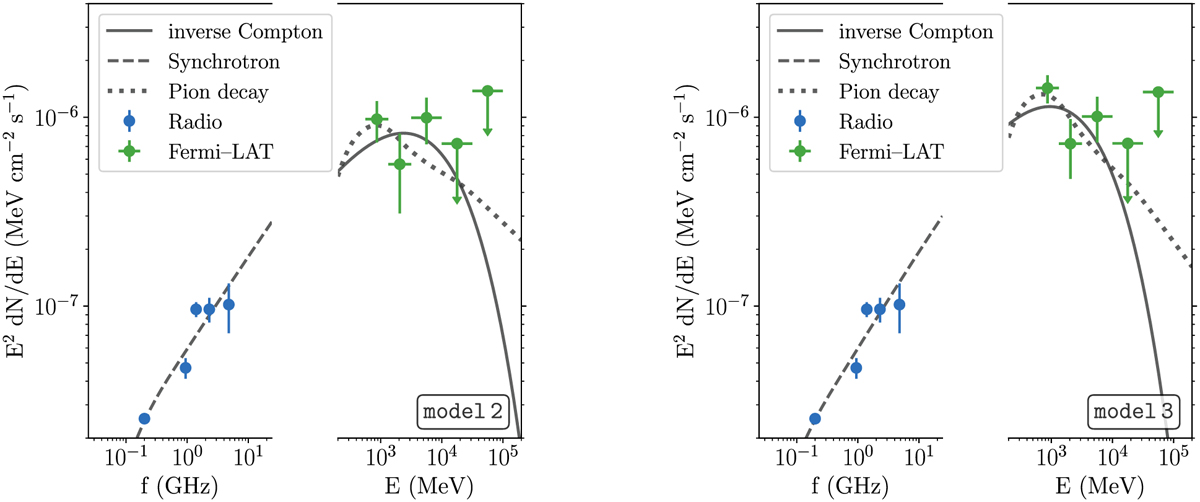
Multiwavelength SED from G288.8–6.3. The blue points are radio-flux measurements from Filipović et al. (2023), and the green points are the Fermi-LAT data points representing model 2 (left) and model 3 (right). The curves represent the best-fit Naima models with the particle population parameters indicated in Table 3. The solid curves represent the synchrotron emission, the dashed curves the inverse-Compton emission, and the dotted curves the Pion-decay emission.
Current usage metrics show cumulative count of Article Views (full-text article views including HTML views, PDF and ePub downloads, according to the available data) and Abstracts Views on Vision4Press platform.
Data correspond to usage on the plateform after 2015. The current usage metrics is available 48-96 hours after online publication and is updated daily on week days.
Initial download of the metrics may take a while.