Fig. 2
Download original image
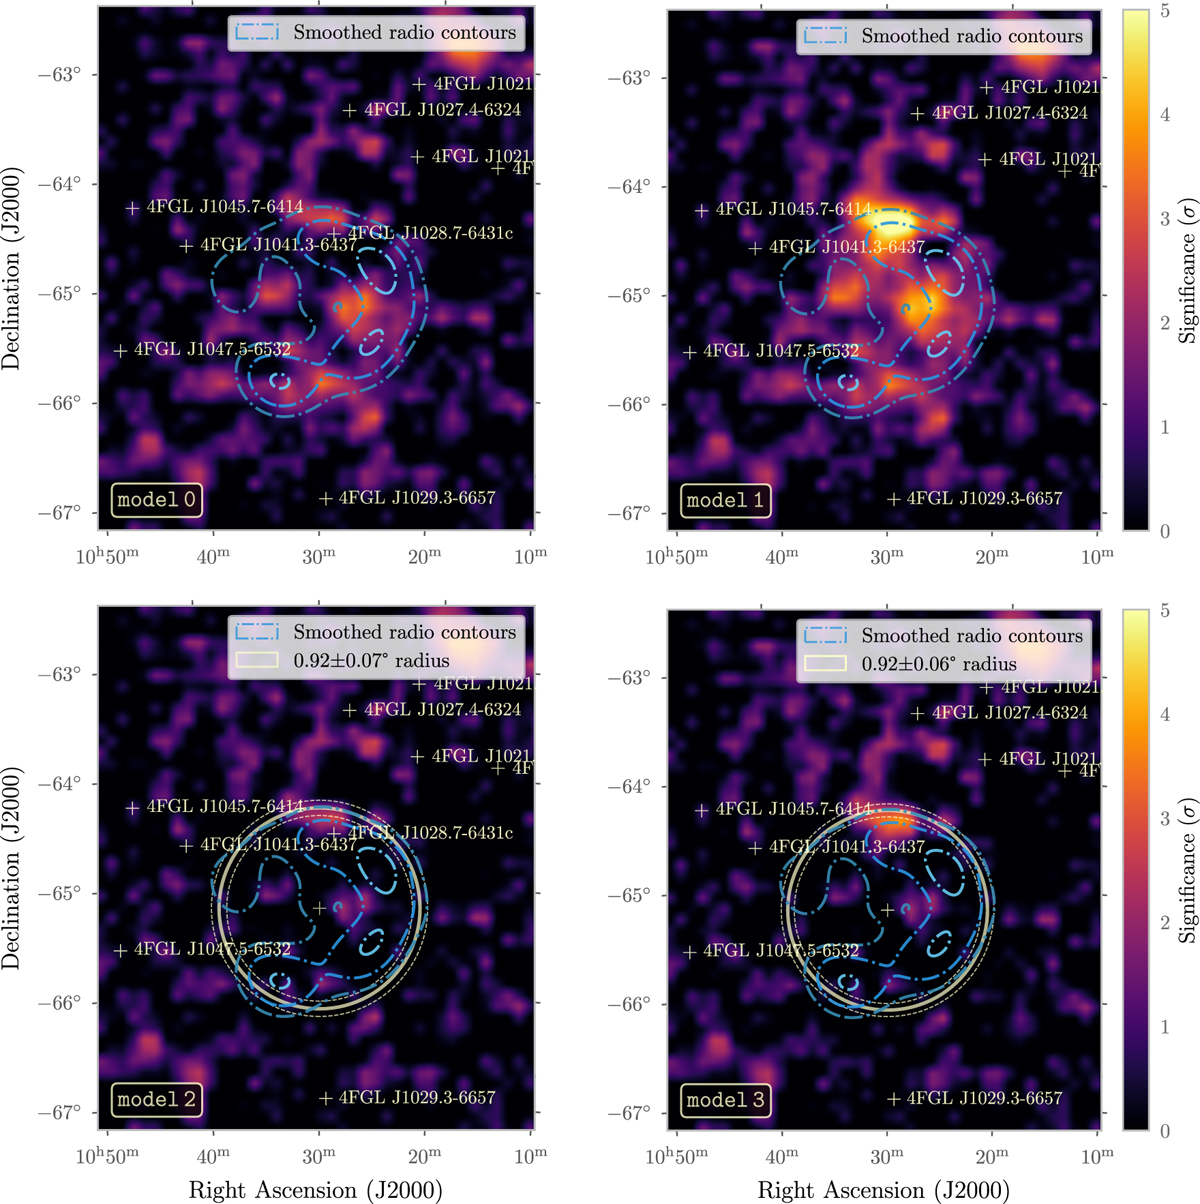
Residual maps of the G288.8–6.3 region around Ancora SNR, as seen with Fermi-LAT. Top row: residual maps of model 0 (top left, obtained directly from the 4FGL-DR3 catalogue) and model 1 (top right). Bottom row: residual maps for model 2 (bottom left) and model 3 (bottom right, position of J1028 marked for reference), after adding a RadialDisk spatial model and a PowerLaw spectral model and refitting. All fits were in the energy range of 400 MeV–1 TeV. The blue contours show smoothed radio emission. Models 0 and 1 show γ-ray excess overlapping with this region. The circles with radius 0.92° in the bottom panels show the disk radius obtained from the fits of models 2 and 3. The top and bottom panels represent different fits as the region is refit after adding the extended SNR model. The bottom panels represent the exact fit shown in Fig. 1, except for the removal of the extended model.
Current usage metrics show cumulative count of Article Views (full-text article views including HTML views, PDF and ePub downloads, according to the available data) and Abstracts Views on Vision4Press platform.
Data correspond to usage on the plateform after 2015. The current usage metrics is available 48-96 hours after online publication and is updated daily on week days.
Initial download of the metrics may take a while.