Fig. 1
Download original image
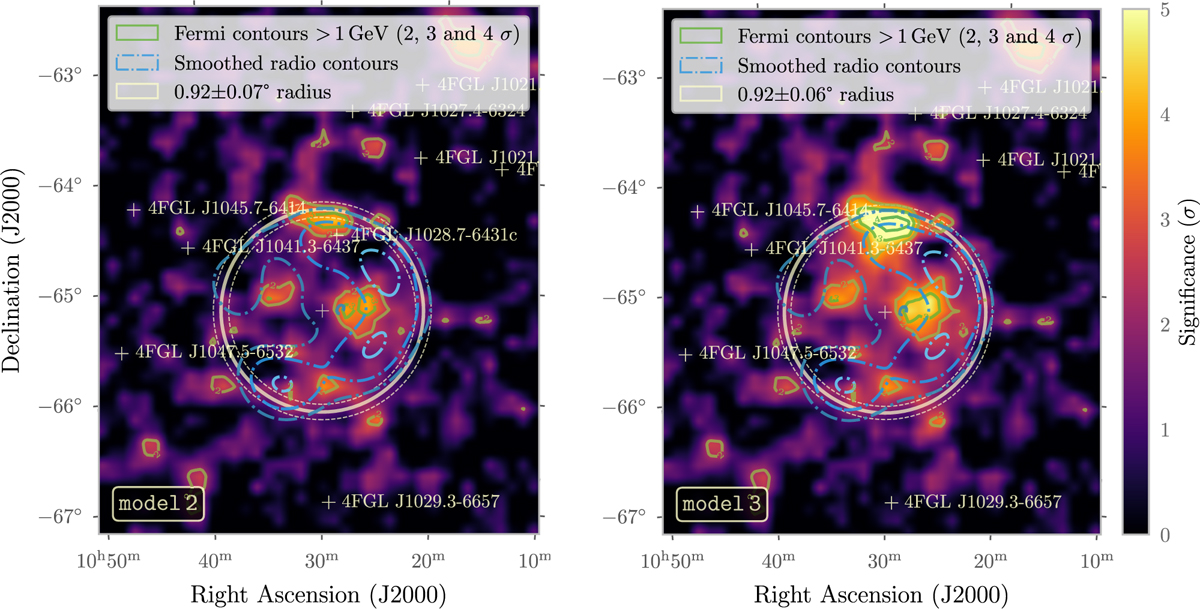
Significance maps of the G288.8–6.3 region, as seen with Fermi-LAT, after fitting with a RadialDisk spatial model and a PowerLaw spectral model with (left, model 2) and without (right, model 3) modelling J 1028 in the energy range of 400 MeV–1 TeV. The circles with radius 0.92° show the disk radius obtained from the respective fits. The plots show the significance map after subtracting all the fitted sources, except for the SNR. The maps are overlaid with Fermi contours for significance values above 1 GeV, and the smoothed radio contours from the ASKAP instrument at 954 MHz.
Current usage metrics show cumulative count of Article Views (full-text article views including HTML views, PDF and ePub downloads, according to the available data) and Abstracts Views on Vision4Press platform.
Data correspond to usage on the plateform after 2015. The current usage metrics is available 48-96 hours after online publication and is updated daily on week days.
Initial download of the metrics may take a while.