Fig. B.1
Download original image
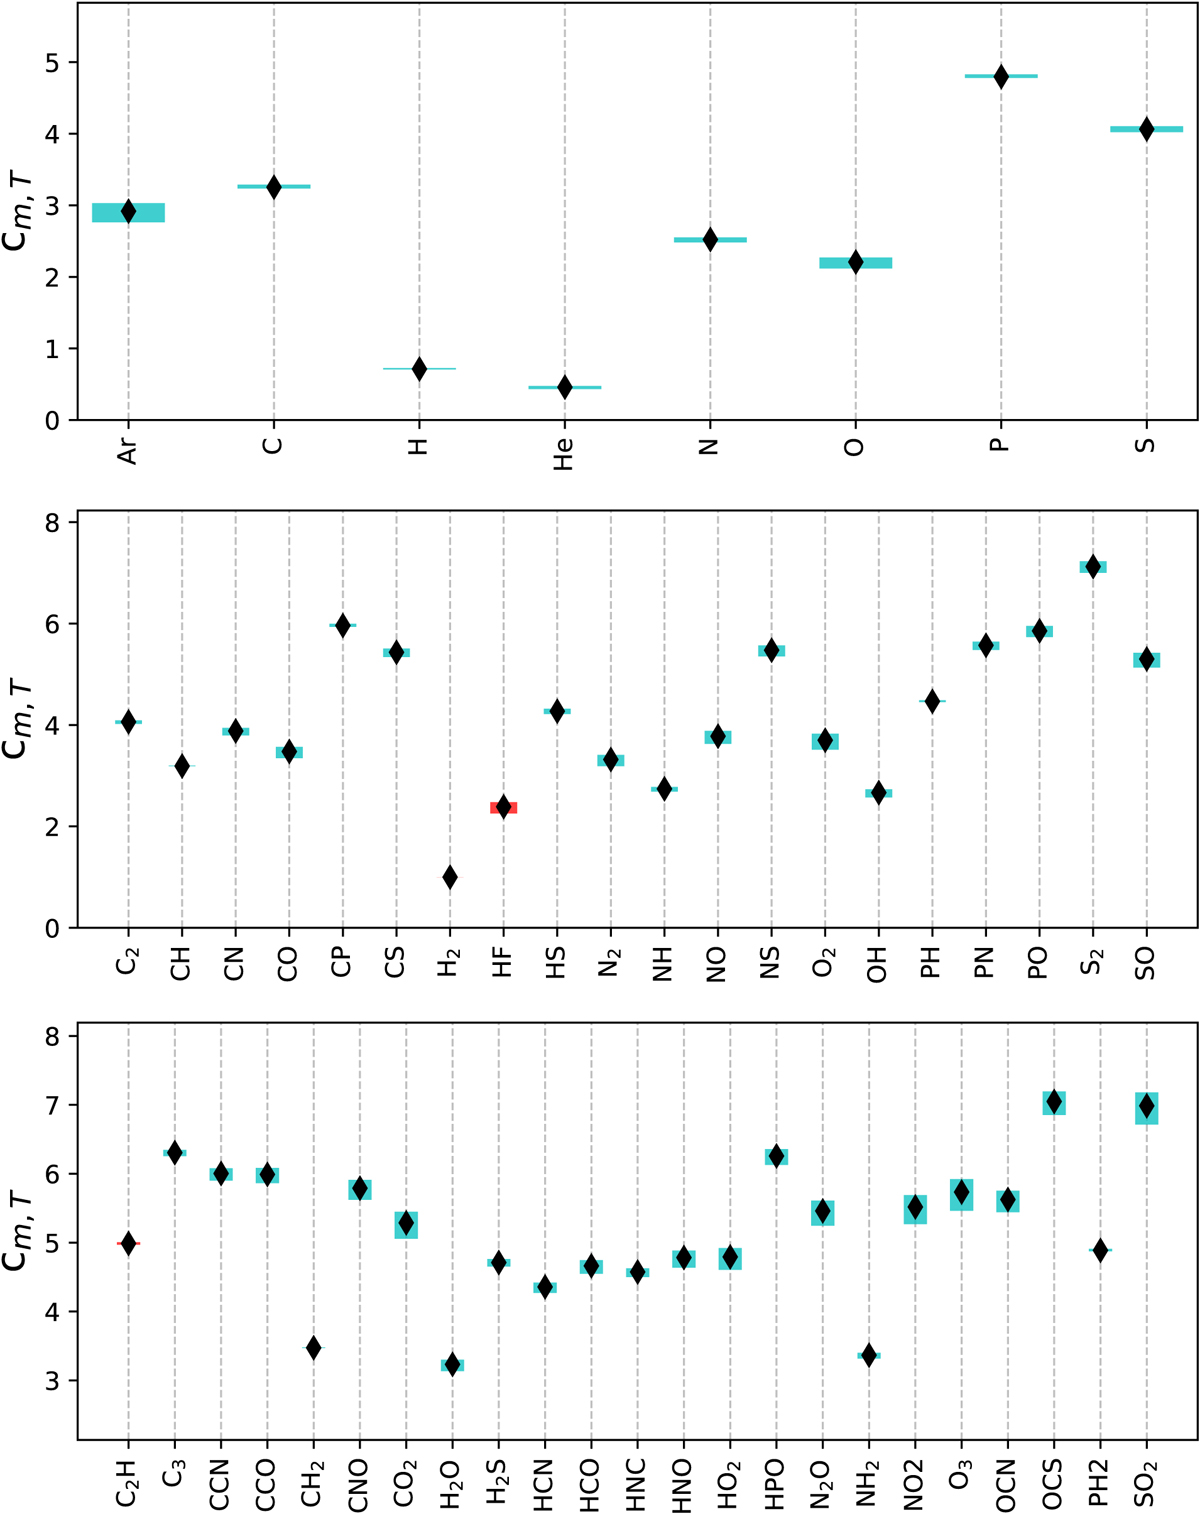
Reaction rate coefficients following Equation 14 for all neutral molecules in the database. The boxes show the minimum and maximum coefficients in the column density range 1020 cm−2 ![]() cm-2, and plus signs show the mean. The cyan boxes denote molecules using the MP2 calculations, and the red boxes denote calculations from Heathcote & Vallance (2018).
cm-2, and plus signs show the mean. The cyan boxes denote molecules using the MP2 calculations, and the red boxes denote calculations from Heathcote & Vallance (2018).
Current usage metrics show cumulative count of Article Views (full-text article views including HTML views, PDF and ePub downloads, according to the available data) and Abstracts Views on Vision4Press platform.
Data correspond to usage on the plateform after 2015. The current usage metrics is available 48-96 hours after online publication and is updated daily on week days.
Initial download of the metrics may take a while.