Fig. 6.
Download original image
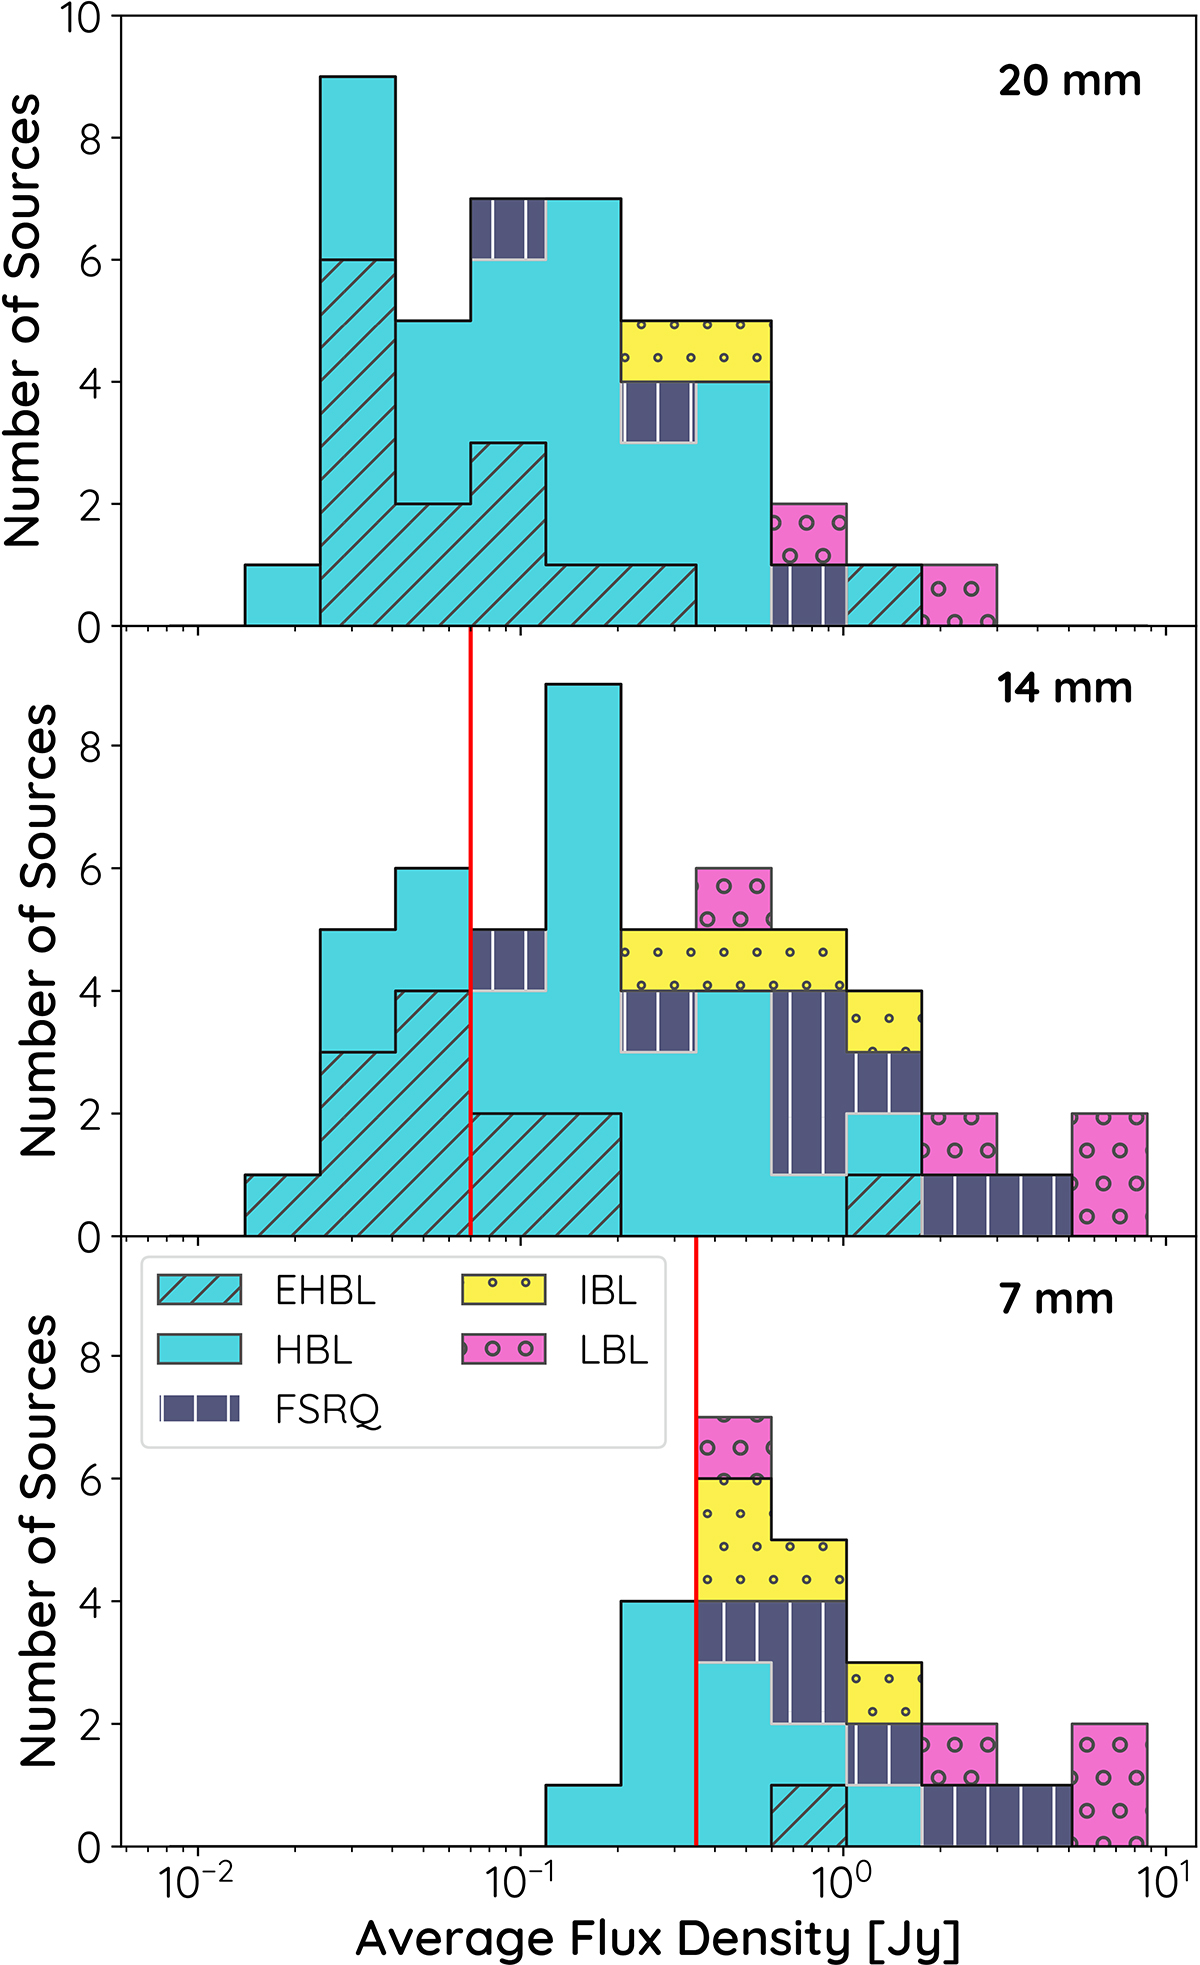
Distribution of the average flux density found in the TELAMON sample sources for the 20 mm (top), 14 mm (center), and 7 mm (bottom) receivers. The histogram is divided into the source classes EHBL (blue with diagonal stripes), HBL (blue), IBL (yellow with dots), LBL (magenta with circles), and FSRQ (black with vertical stripes). The red vertical lines indicate the flux density above which one can expect a > 50% detection chance per epoch (see Sect. 4.3). Below these thresholds the statistics are significantly affected due to the limited telescope sensitivity. For 20 mm we do not have enough data on the faintest sources to determine this limit.
Current usage metrics show cumulative count of Article Views (full-text article views including HTML views, PDF and ePub downloads, according to the available data) and Abstracts Views on Vision4Press platform.
Data correspond to usage on the plateform after 2015. The current usage metrics is available 48-96 hours after online publication and is updated daily on week days.
Initial download of the metrics may take a while.