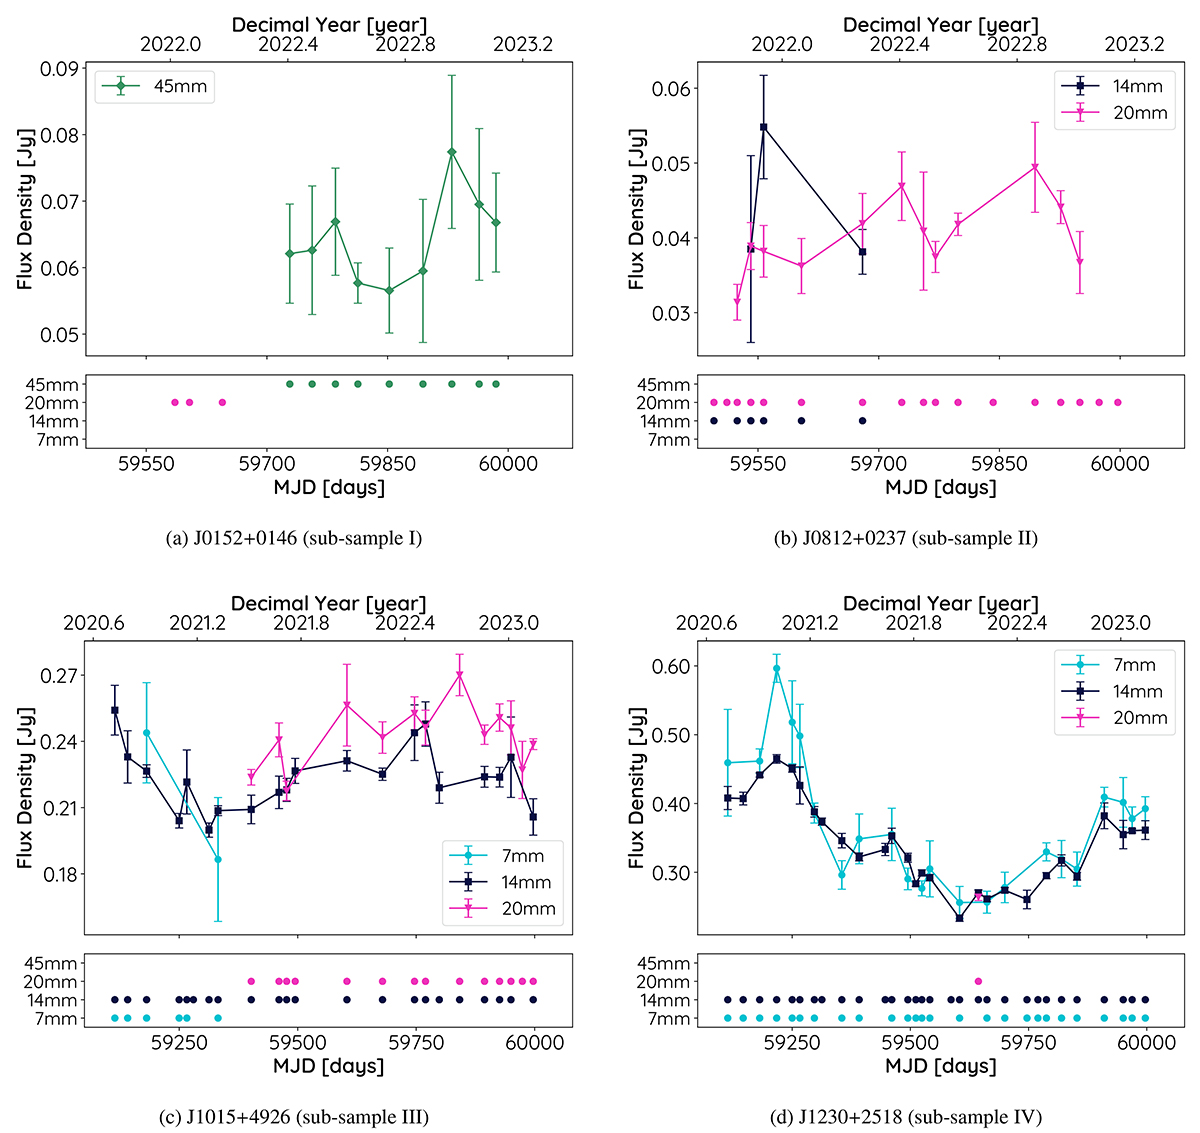
Fig. 10.
Download original image
Illustrative light curves (upper panels) of four selected sources from the TELAMON TeV-sample. The flux densities were averaged over the individual receiver sub-bands as described in Sect. 3.2.1. The lower panels indicate the times of observation with the given receiver. If there is no matching flux density at the same time in the light curve, the source was not detected.
Current usage metrics show cumulative count of Article Views (full-text article views including HTML views, PDF and ePub downloads, according to the available data) and Abstracts Views on Vision4Press platform.
Data correspond to usage on the plateform after 2015. The current usage metrics is available 48-96 hours after online publication and is updated daily on week days.
Initial download of the metrics may take a while.