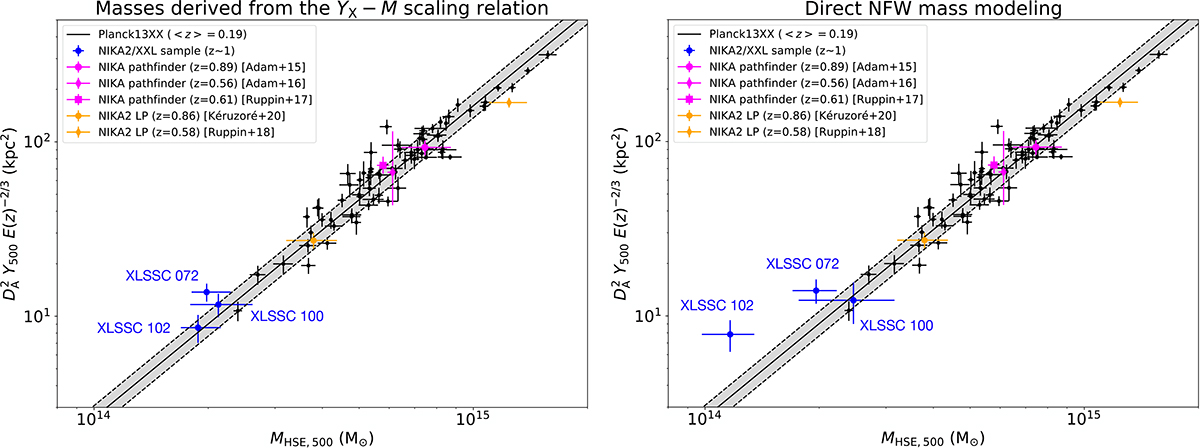
Fig. 8.
Download original image
Scaling relation between the SZ flux and the cluster mass. The blue points are those obtained in this work, at redshift z ∼ 1 and M500 ∼ 2 × 10¹⁴ M⊙. The black points correspond to the Planck calibration sample from Planck Collaboration XX (2014), at a mean redshift of z = 0.19. The gray band provides the best-fit relation and the intrinsic scatter. Other individual measurements obtained with NIKA and NIKA2 are reported as indicated in the legend. We note that the systematic uncertainty associated with the center definition and pressure substructure reported in Paper XLIV is comparable to the size of the error bars for XLSSC 102. Left: masses obtained from YX − M relation. Right: masses obtained from HSE assumption (NFW mass modeling).
Current usage metrics show cumulative count of Article Views (full-text article views including HTML views, PDF and ePub downloads, according to the available data) and Abstracts Views on Vision4Press platform.
Data correspond to usage on the plateform after 2015. The current usage metrics is available 48-96 hours after online publication and is updated daily on week days.
Initial download of the metrics may take a while.