Fig. 3.
Download original image
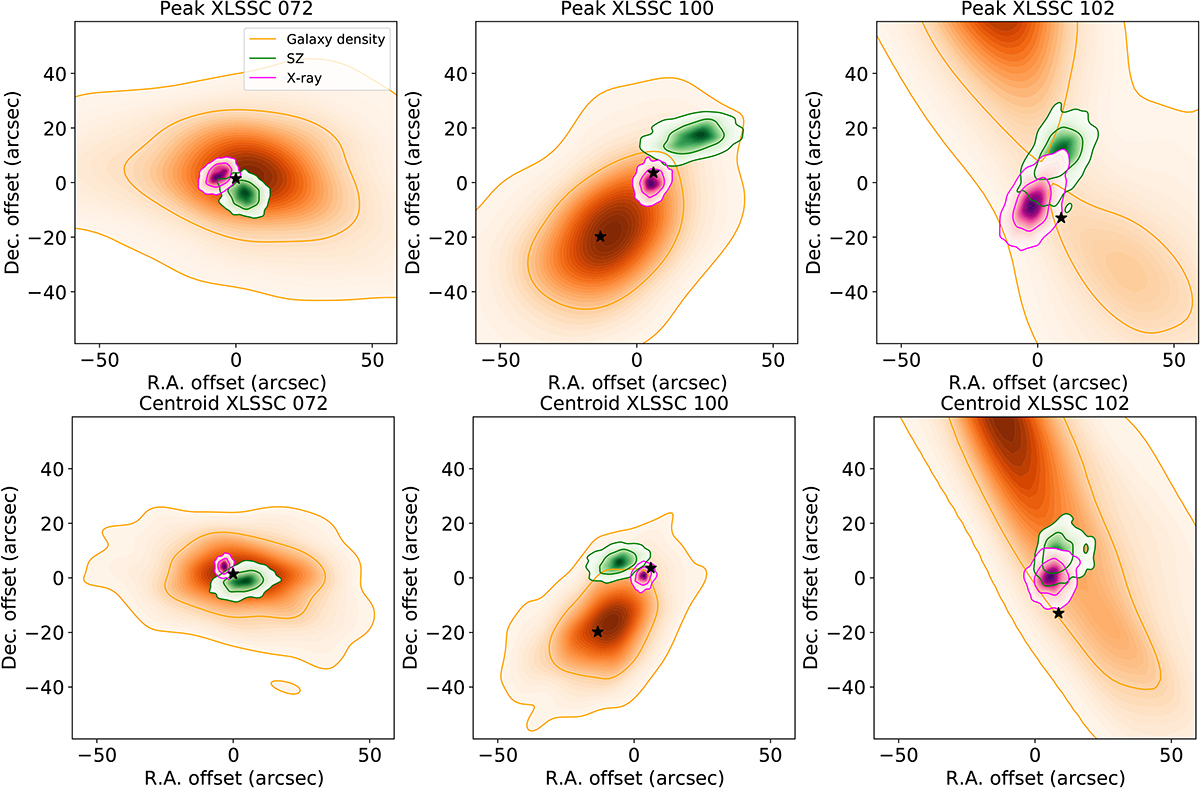
Probability distribution of signal peak (top) and centroid (bottom) location with respect to reference center in three wavelengths, for XLSSC 072, XLSSC 100, and XLSSC 102, from left to right. The BCG coordinates are indicated by the black stars. Contours give the 68% and 95% confidence interval. We note that we recover a posterior distribution that is in good agreement with that reported in Paper XLIV for XLSSC 102.
Current usage metrics show cumulative count of Article Views (full-text article views including HTML views, PDF and ePub downloads, according to the available data) and Abstracts Views on Vision4Press platform.
Data correspond to usage on the plateform after 2015. The current usage metrics is available 48-96 hours after online publication and is updated daily on week days.
Initial download of the metrics may take a while.