Fig. 2.
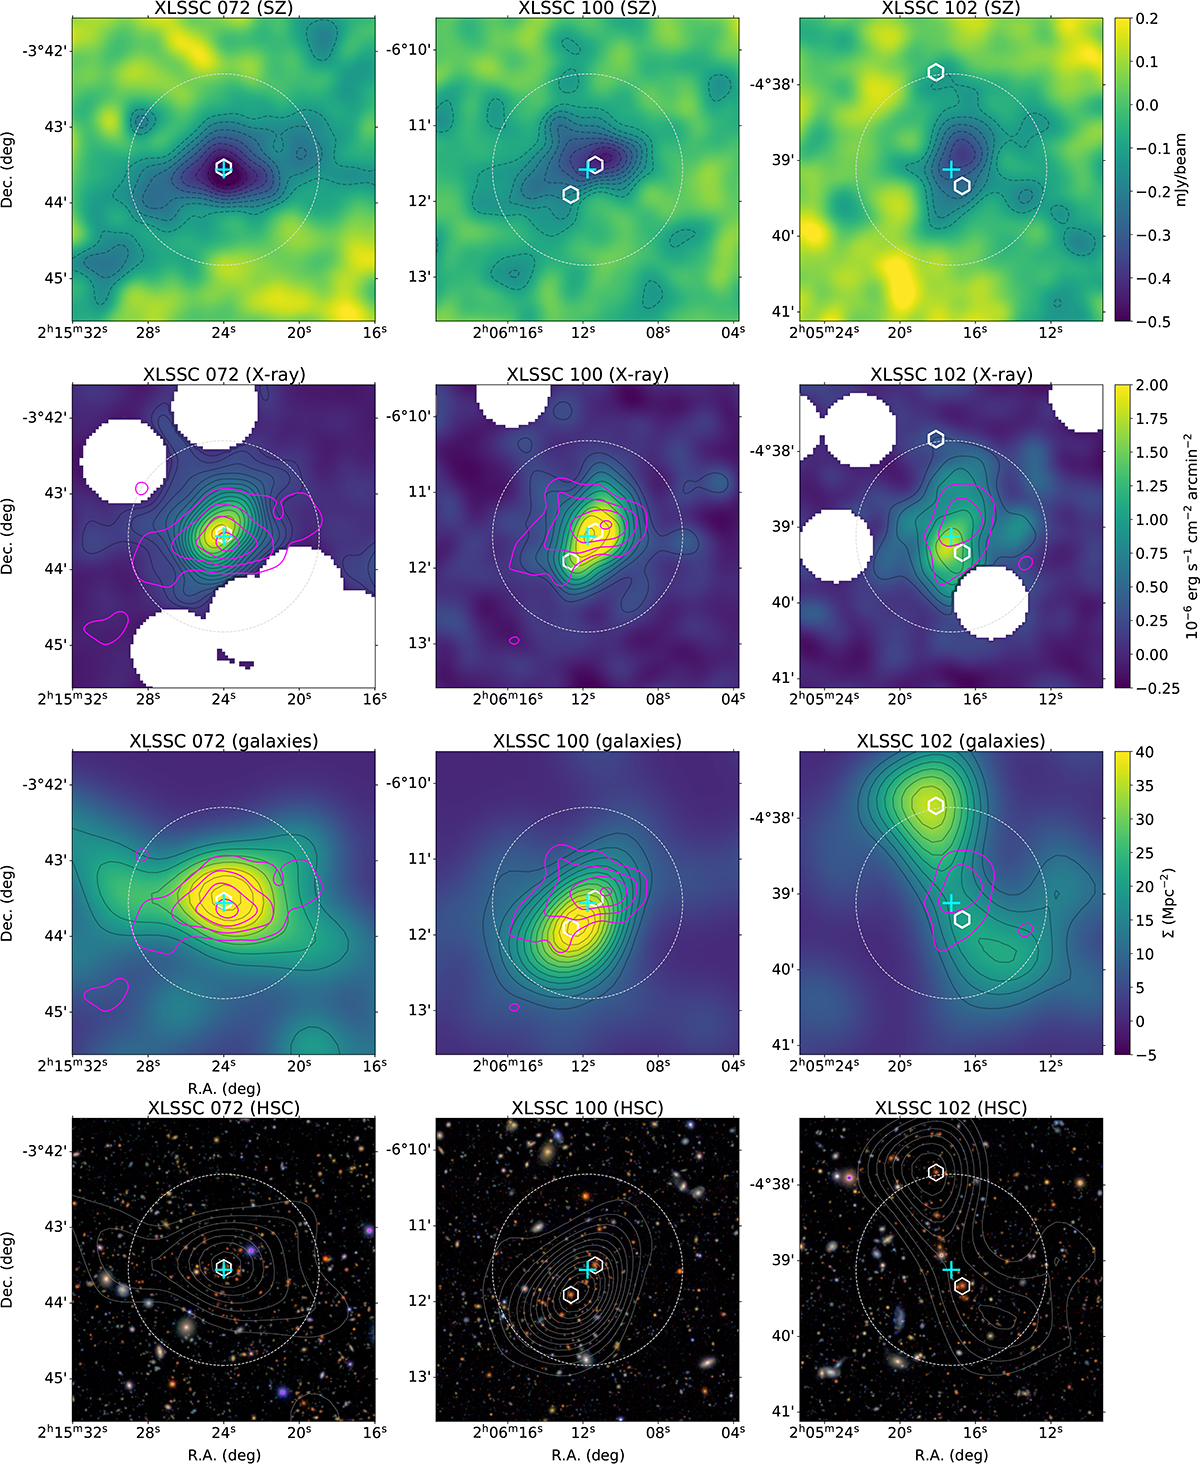
Download original image
Comparison of SZ, X-ray, and optical data for XLSSC 072 (left), XLSSC 100 (center), and XLSSC 102 (right). First row: point-source-subtracted 150 GHz SZ surface brightness images with S/N contours. Second row: X-ray surface brightness images with S/N contours. Point sources from Paper XXVII have been masked. Third row: CFHTLS derived galaxy density images, Σ. Fourth row: HSC color images made by combining the R, I, and Z filters. In all panels, the cyan cross indicates the reference centers and the BCG positions are indicated as white hexagons. The gray dashed circles indicate the characteristic radii θ500 estimated via the YX − M scaling (see Sect. 5). In all panels, the black S/N (or S/B) contours start at 2σ and are separated by 1σ each. Magenta contours correspond to the SZ S/N, starting at 3σ and separated by 2σ each. We note that the XLSSC 102 data were already reported in Paper XLIV.
Current usage metrics show cumulative count of Article Views (full-text article views including HTML views, PDF and ePub downloads, according to the available data) and Abstracts Views on Vision4Press platform.
Data correspond to usage on the plateform after 2015. The current usage metrics is available 48-96 hours after online publication and is updated daily on week days.
Initial download of the metrics may take a while.