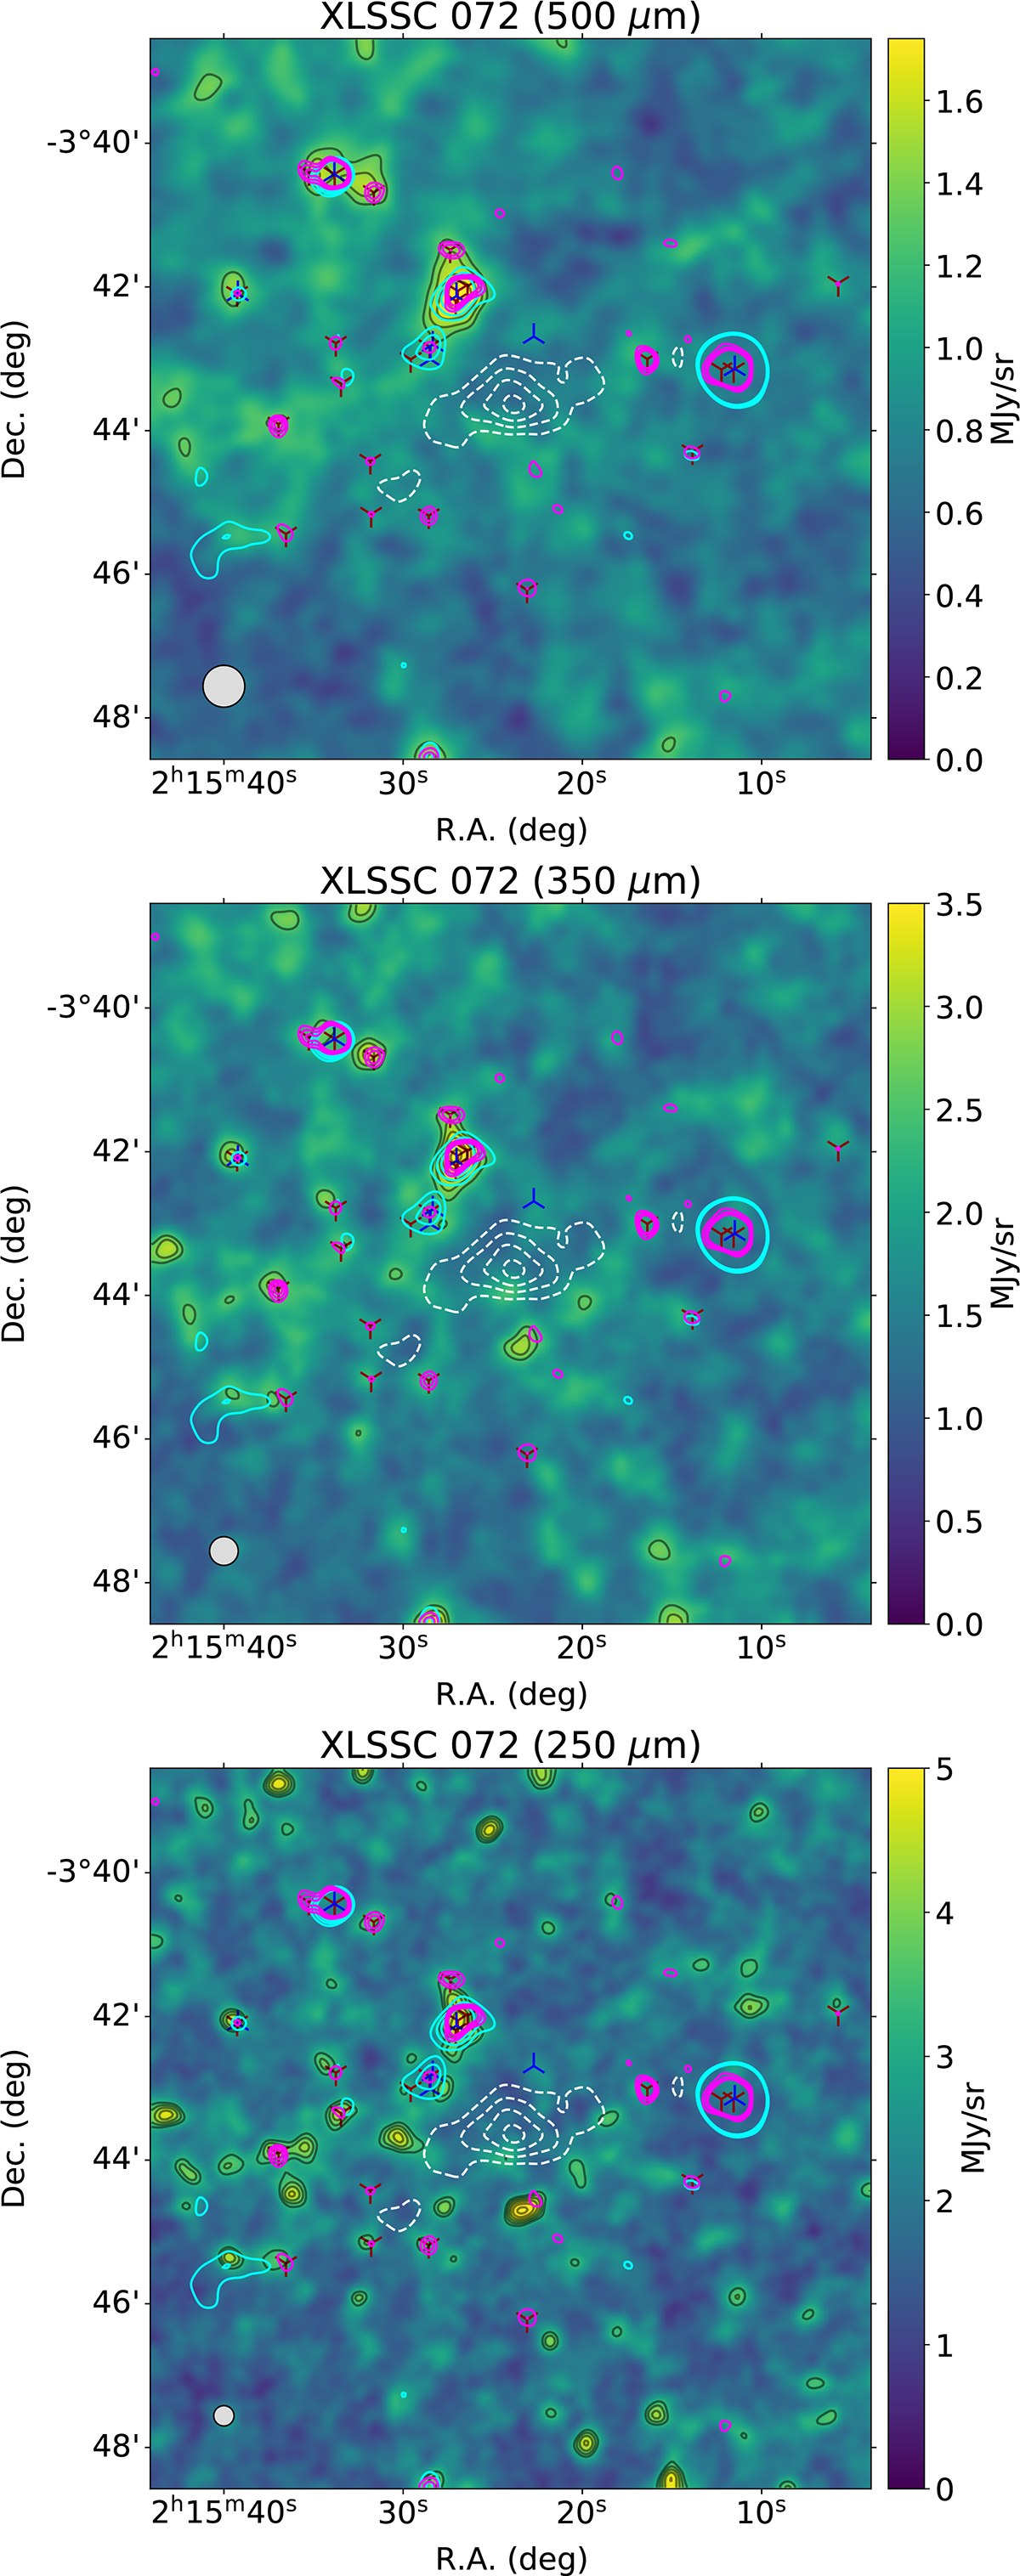
Fig. B.2.
Download original image
Herschel/PACS images of XLSSC 072 at 500, 350, and 250 μm (from top to bottom). Black contours give the S/N in units of 1σ, starting at 3σ. The gray circles in the bottom left corner show the PACS beam FWHM in each band. White dashed contours show the NIKA2 150 GHz contours at -3, -5, -7, and -9 σ. Magenta and cyan contours show the 3, 4, and 5σ NIKA2 S/N at 150 and 260 GHz, respectively. The blue and red crosses indicate the point sources identified at 150 and 260 GHz in the NIKA2 data.
Current usage metrics show cumulative count of Article Views (full-text article views including HTML views, PDF and ePub downloads, according to the available data) and Abstracts Views on Vision4Press platform.
Data correspond to usage on the plateform after 2015. The current usage metrics is available 48-96 hours after online publication and is updated daily on week days.
Initial download of the metrics may take a while.