Fig. B.1.
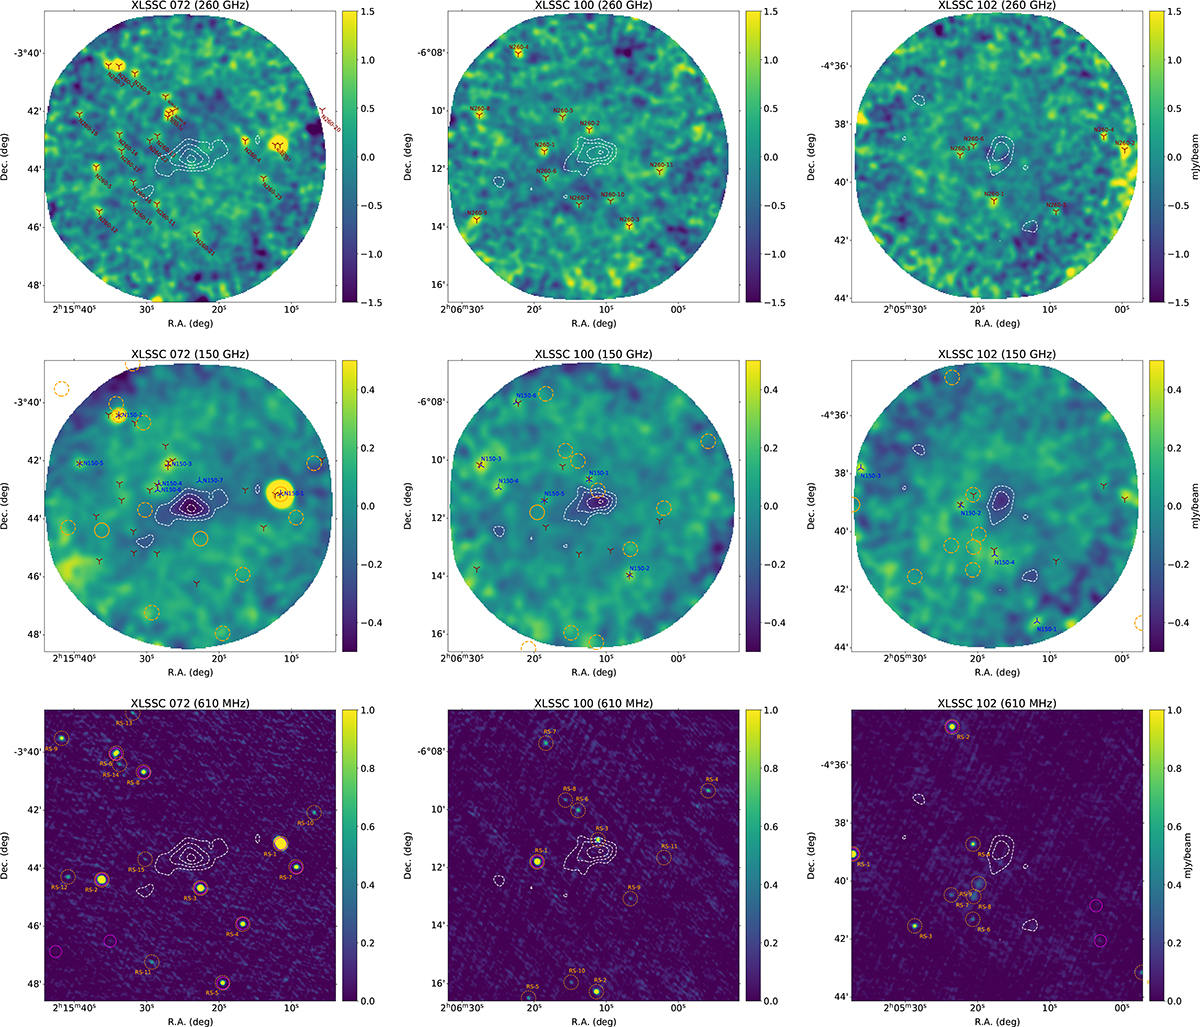
Download original image
Submillimeter and radio sources’ identification in the fields of XLSSC 072 (left), XLSSC 100 (center), and XLSSC 102 (right). Top: NIKA2 260 GHz images with detected sources indicated as red crosses. Middle: NIKA2 150 GHz images with detected sources indicated as blue crosses. Bottom: GMRT images at 610 MHz, with detected sources indicated as orange circles. Sources with NVSS counterparts are indicated as solid lines, and dashed otherwise. FIRST sources are indicated as magenta circles. The 150 GHz S/N contours at -9,-7,-5, and -3 σ are reported in all maps. All identified radio and submillimeter sources are reported in the 150 GHz maps.
Current usage metrics show cumulative count of Article Views (full-text article views including HTML views, PDF and ePub downloads, according to the available data) and Abstracts Views on Vision4Press platform.
Data correspond to usage on the plateform after 2015. The current usage metrics is available 48-96 hours after online publication and is updated daily on week days.
Initial download of the metrics may take a while.