Fig. 2
Download original image
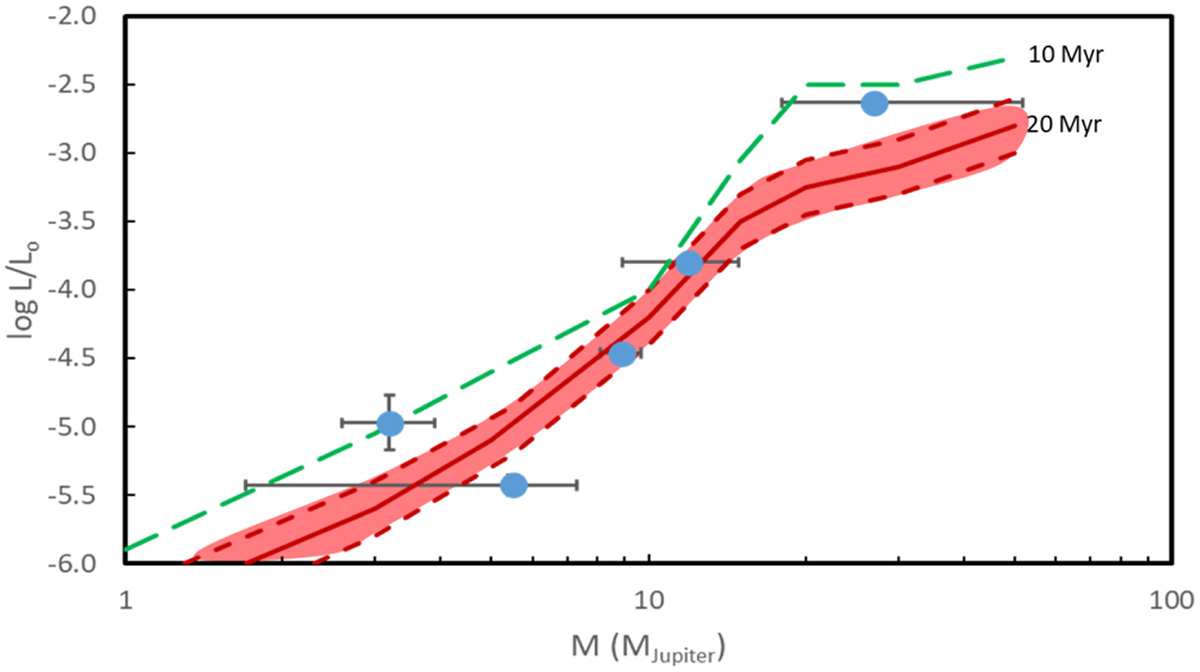
Dynamical mass-luminosity relation for sub-stellar objects detected in the BPMG. The solid red and the dashed green lines are averages of the predictions by models of Mordasini etal. (2017) forages of 20 and 10 Myr, respectively. The shaded red region between the dotted red lines represents the range of values that are expected for a 20 Myr age, depending on the peculiar evolution of individual objects.
Current usage metrics show cumulative count of Article Views (full-text article views including HTML views, PDF and ePub downloads, according to the available data) and Abstracts Views on Vision4Press platform.
Data correspond to usage on the plateform after 2015. The current usage metrics is available 48-96 hours after online publication and is updated daily on week days.
Initial download of the metrics may take a while.