Fig. 8.
Download original image
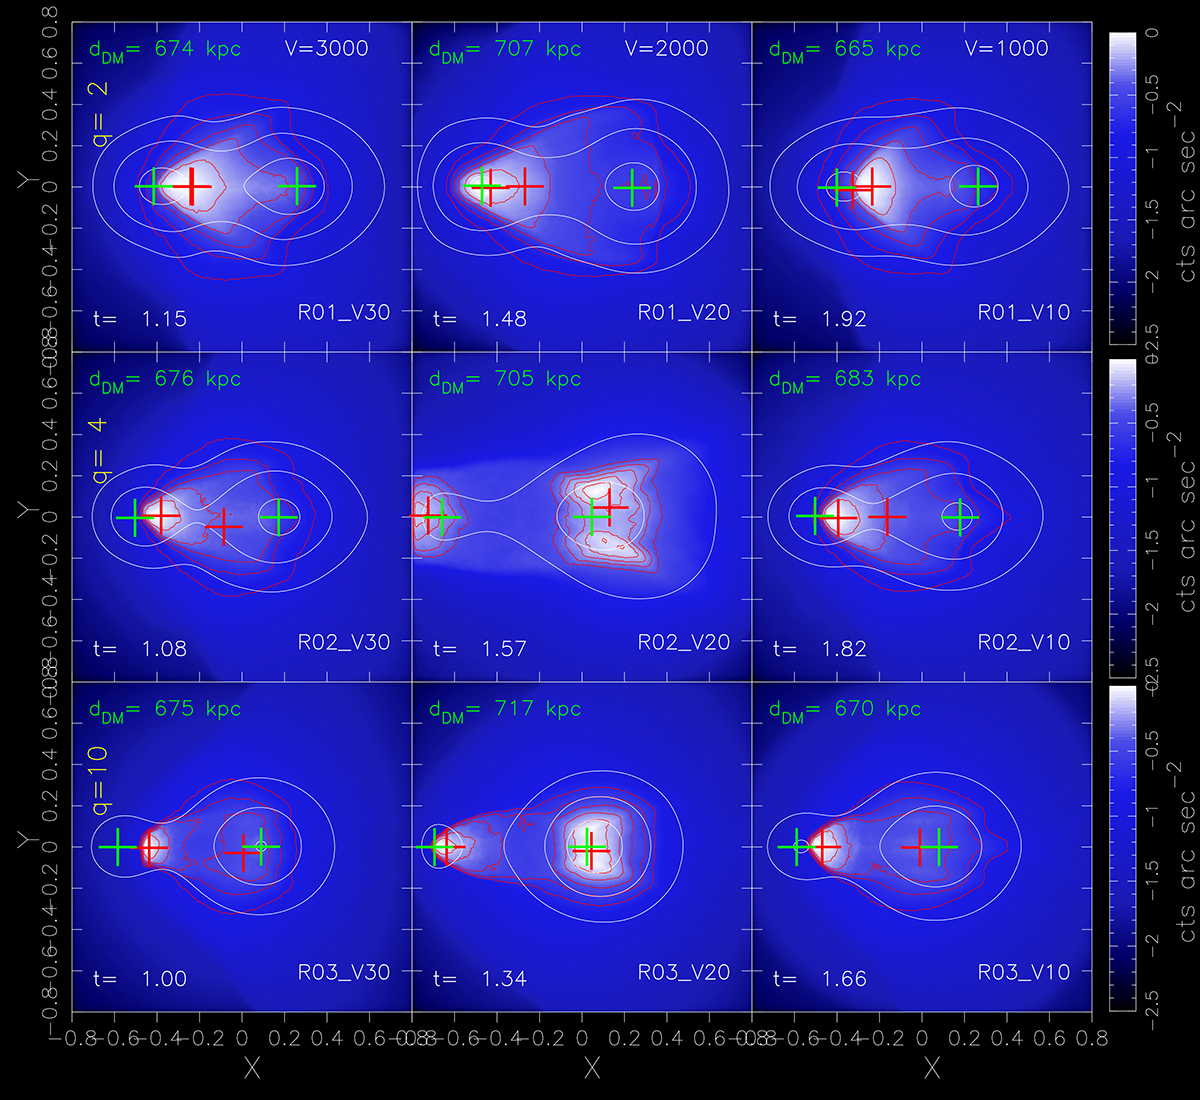
Surface brightness maps for the head-on mergers described in Sect. 3.2. As in the previous maps, time is in Gyr, with t = 0 at the start of the simulation and the box size is 1.6 Mpc. In each panel is indicated the collision model whose initial merging parameters are given in Table 5. Each row of panels refers to simulations with the same value of the mass ratio q, while each column is for simulations having the same value of V. This is reported in km s−1. The maps are extracted at output times when the distance dDM between the mass centroids of the two clusters is approximately dDM ≃ 700 kpc. As in Fig. 1, the crosses indicate the projected spatial locations of the mass (green) and X-ray surface brightness (red) centroids.
Current usage metrics show cumulative count of Article Views (full-text article views including HTML views, PDF and ePub downloads, according to the available data) and Abstracts Views on Vision4Press platform.
Data correspond to usage on the plateform after 2015. The current usage metrics is available 48-96 hours after online publication and is updated daily on week days.
Initial download of the metrics may take a while.