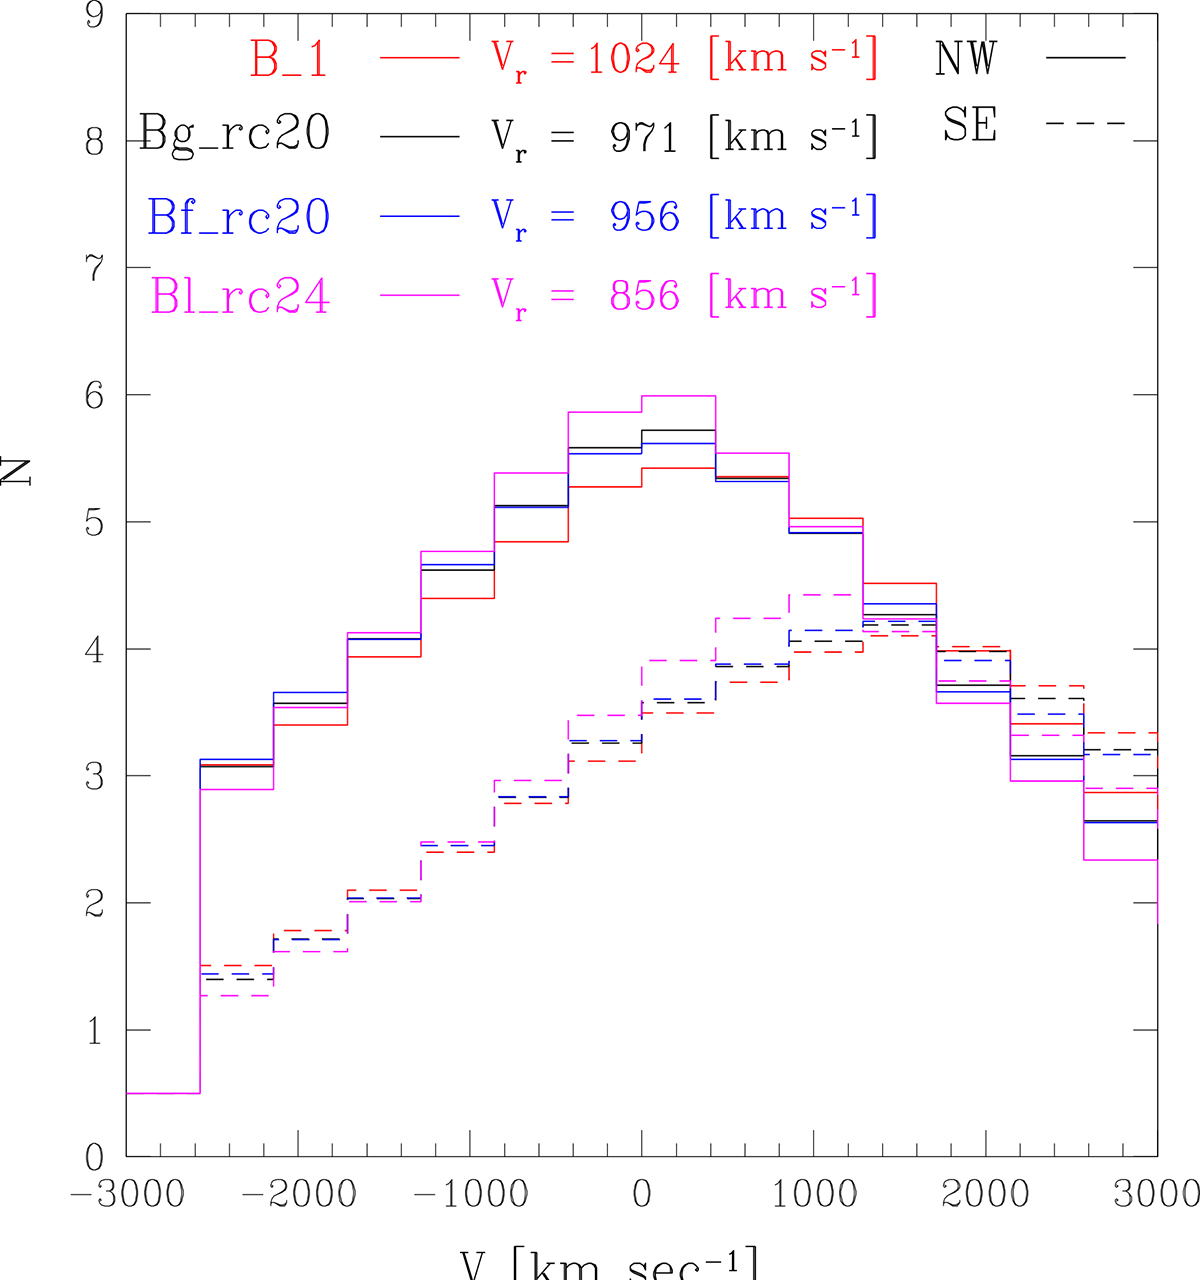
Fig. 7.
Download original image
Histograms of the DM line-of-sight velocity distribution for the NW and SE clusters of the same merger models shown in Fig. 6. The NW (SE) histograms are normalized to a total number of 51 (36) members, as in Fig. 9 of ZYL15. For each model in the figure is reported the relative mean radial velocity between the SE and NW cluster components.
Current usage metrics show cumulative count of Article Views (full-text article views including HTML views, PDF and ePub downloads, according to the available data) and Abstracts Views on Vision4Press platform.
Data correspond to usage on the plateform after 2015. The current usage metrics is available 48-96 hours after online publication and is updated daily on week days.
Initial download of the metrics may take a while.