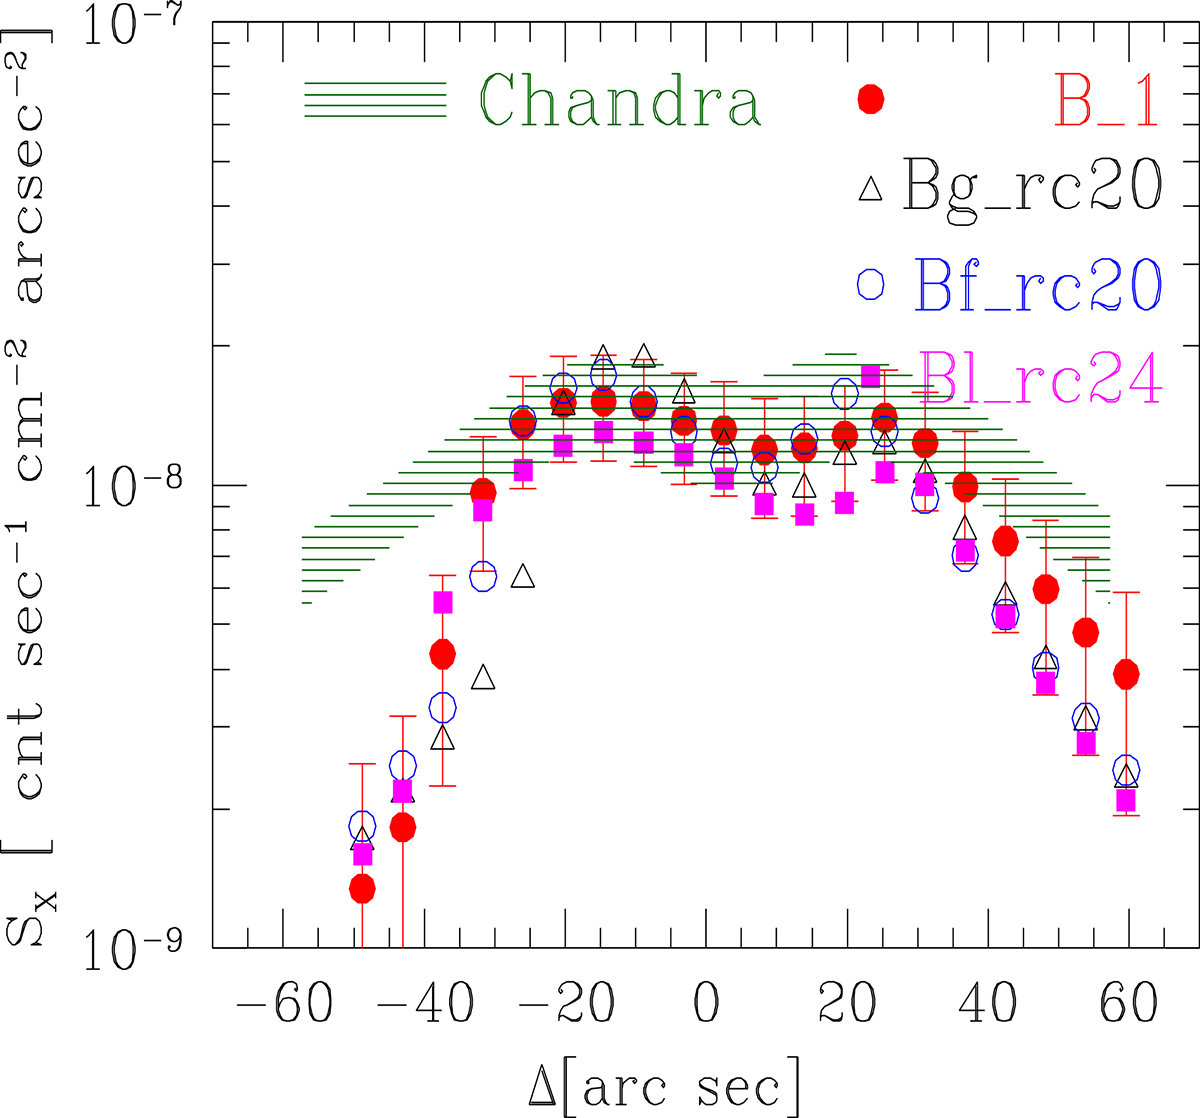
Fig. 6.
Download original image
X-ray surface brightness profiles across the wake of several cluster merger models. The extraction region of the profiles is shown in the previous images as the dashed orange line. Distance is measured in arc sec along the extraction path, model B_1 is the corresponding B model of ZYL15 and is used here as a reference model. The width of the hatched region represents the uncertainties of the Chandra observation, as shown by the blue error bars in Fig. 8 of ZYL15 (courtesy of C. Zhang).
Current usage metrics show cumulative count of Article Views (full-text article views including HTML views, PDF and ePub downloads, according to the available data) and Abstracts Views on Vision4Press platform.
Data correspond to usage on the plateform after 2015. The current usage metrics is available 48-96 hours after online publication and is updated daily on week days.
Initial download of the metrics may take a while.