Open Access
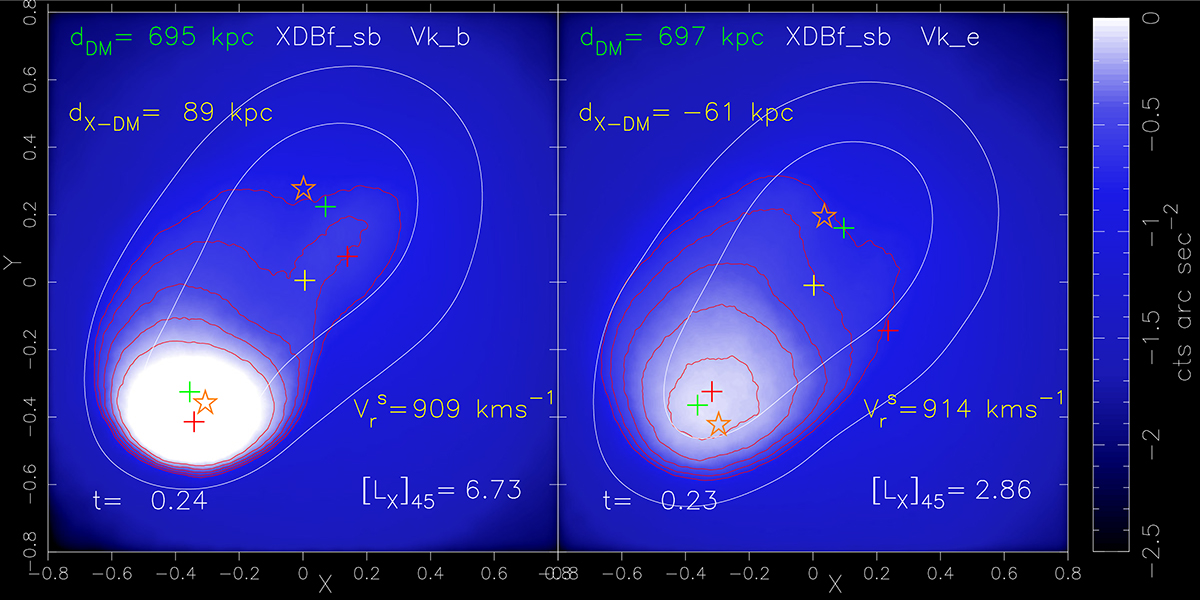
Fig. 17.
Download original image
X-ray maps extracted from two alternative simulations of the merger model XDBf_sb. The only difference in the simulation setup is now in the initial gas density profile for the SE cluster. This is described according to models Vk_b (left panel) and Vk_e (right panel) of Fig. 16.
Current usage metrics show cumulative count of Article Views (full-text article views including HTML views, PDF and ePub downloads, according to the available data) and Abstracts Views on Vision4Press platform.
Data correspond to usage on the plateform after 2015. The current usage metrics is available 48-96 hours after online publication and is updated daily on week days.
Initial download of the metrics may take a while.