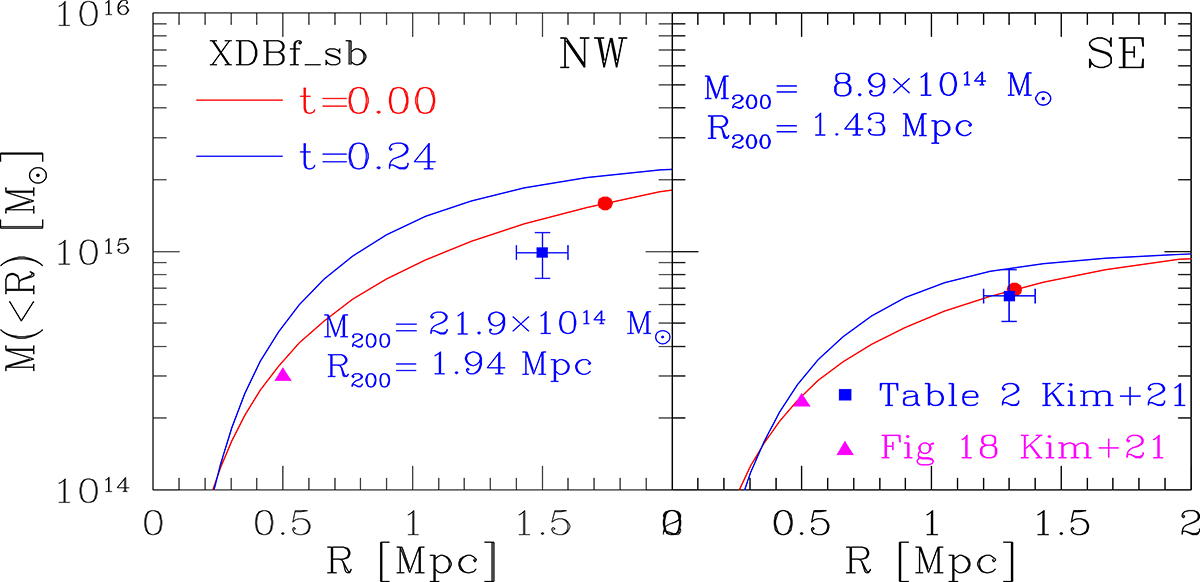
Fig. 14.
Download original image
Total mass as a function of radius, R, for the two clusters of the merger model XDBf_sb. As in Fig. 13, the left (right) panel is for the NW (SE) cluster. Solid blue lines refer to the observer epoch, and red lines at t = 0. The quoted values of M200 and r200 are determined according to Eq. (3) from the cumulative mass profile . In each panel the filled blue square refers to the lensing mass estimate of the corresponding cluster, as reported in Table 2 of Kim et al. (2021); from the cumulative mass profile of their Fig. 18 we also extrapolated the cluster mass within 500 kpc, as indicated by the magenta triangle. For the same cluster the point denoted by a filled red circle corresponds to the initial values of M200 and r200, as given in Tables 1 and 2 for the merger model Bf_rc20.
Current usage metrics show cumulative count of Article Views (full-text article views including HTML views, PDF and ePub downloads, according to the available data) and Abstracts Views on Vision4Press platform.
Data correspond to usage on the plateform after 2015. The current usage metrics is available 48-96 hours after online publication and is updated daily on week days.
Initial download of the metrics may take a while.