Fig. 13.

Download original image
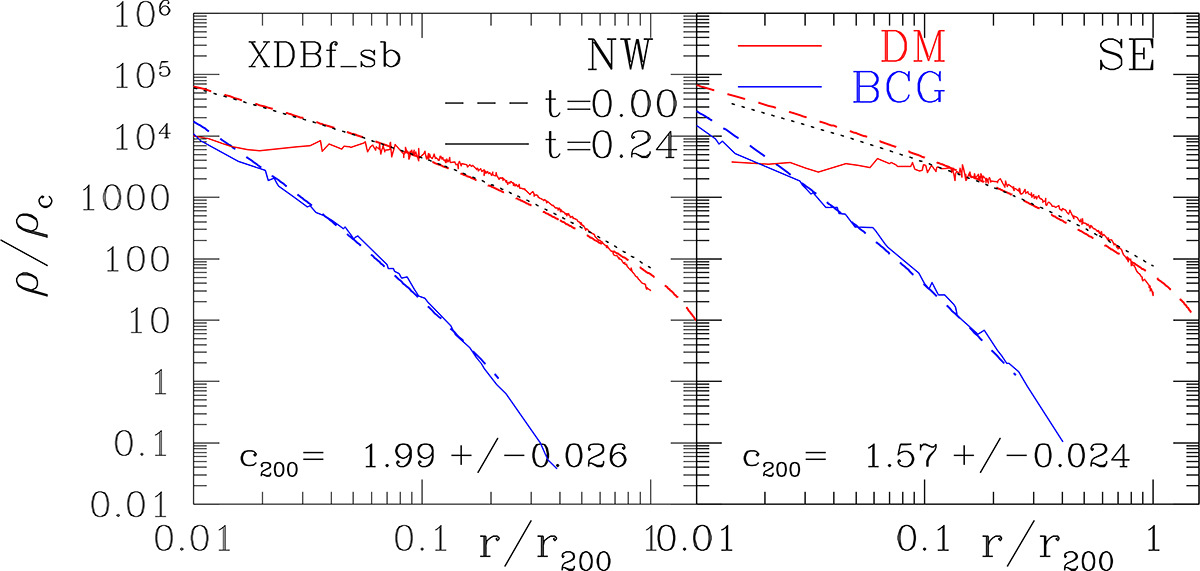
Radial density profiles of the stellar and DM components of the merger model XDBf_sb of Fig. 12. The left (right) panel is for the NW (SE) cluster. Solid lines refer to the present epoch, after the core passage, and dashed lines correspond to the start of the simulation. The profiles of the different components are indicated by different colors, red and blue are for DM and BCG, respectively. The origin of the profiles is centered on the centroid of the corresponding mass component. In each panel is reported the value of c200, together with its statistical error, as obtained by using an NFW profile to fit the cored DM density profile. The adopted fitting procedure is the same as that described by Duffy et al. (2008), the corresponding best-fit density profile is indicated by the black dots.
Current usage metrics show cumulative count of Article Views (full-text article views including HTML views, PDF and ePub downloads, according to the available data) and Abstracts Views on Vision4Press platform.
Data correspond to usage on the plateform after 2015. The current usage metrics is available 48-96 hours after online publication and is updated daily on week days.
Initial download of the metrics may take a while.


