Fig. 12.
Download original image
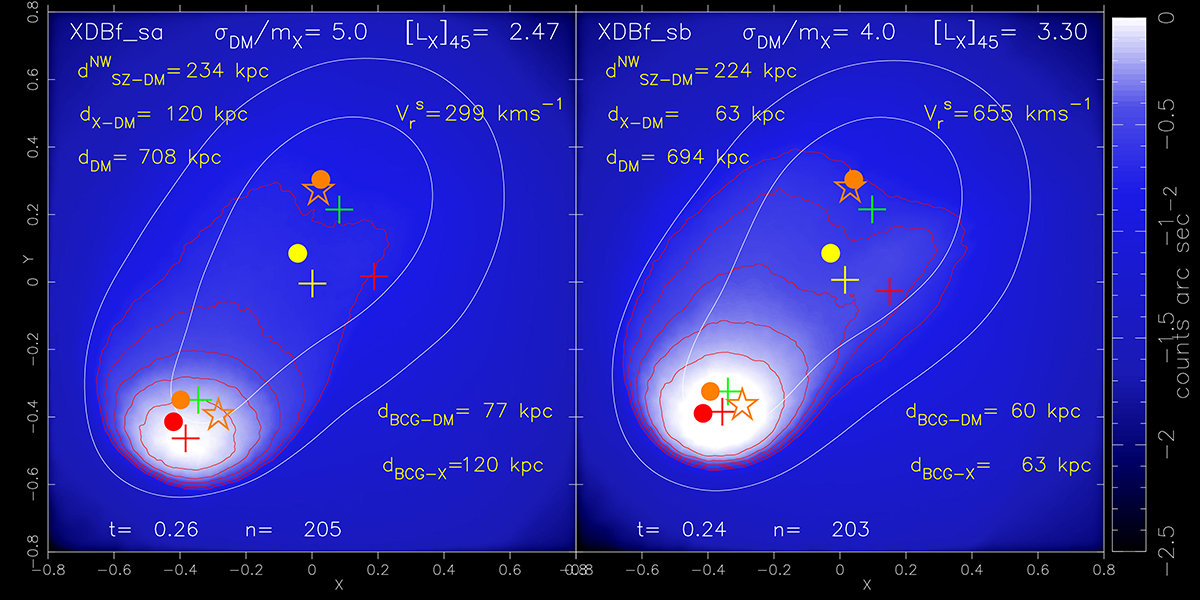
X-ray images extracted at the observer epoch from two SIDM merging simulations. The initial conditions of the two runs are given in Table 7. The meaning of the distances shown in each panel is the same of the ones reported in Fig. 11, with the exception of ![]() , which is the projected distance between the SZ peak and the DM mass centroid of the NW cluster. As in Fig. 10,
, which is the projected distance between the SZ peak and the DM mass centroid of the NW cluster. As in Fig. 10, ![]() is line-of-sight relative mean radial velocity between the two BCGs. The thresholds and the spacing of the contour levels are the same as in Fig. 1. The filled circles indicate the peak locations from several observations, as taken from Fig. 6 of Kim et al. (2021). Their spatial positions have been normalized to the relative distance from the mass centroids (see the main text). The color coding of the circles is the same of the associated crosses, which indicate the projected positions of the corresponding centroids as extracted from the simulations.
is line-of-sight relative mean radial velocity between the two BCGs. The thresholds and the spacing of the contour levels are the same as in Fig. 1. The filled circles indicate the peak locations from several observations, as taken from Fig. 6 of Kim et al. (2021). Their spatial positions have been normalized to the relative distance from the mass centroids (see the main text). The color coding of the circles is the same of the associated crosses, which indicate the projected positions of the corresponding centroids as extracted from the simulations.
Current usage metrics show cumulative count of Article Views (full-text article views including HTML views, PDF and ePub downloads, according to the available data) and Abstracts Views on Vision4Press platform.
Data correspond to usage on the plateform after 2015. The current usage metrics is available 48-96 hours after online publication and is updated daily on week days.
Initial download of the metrics may take a while.