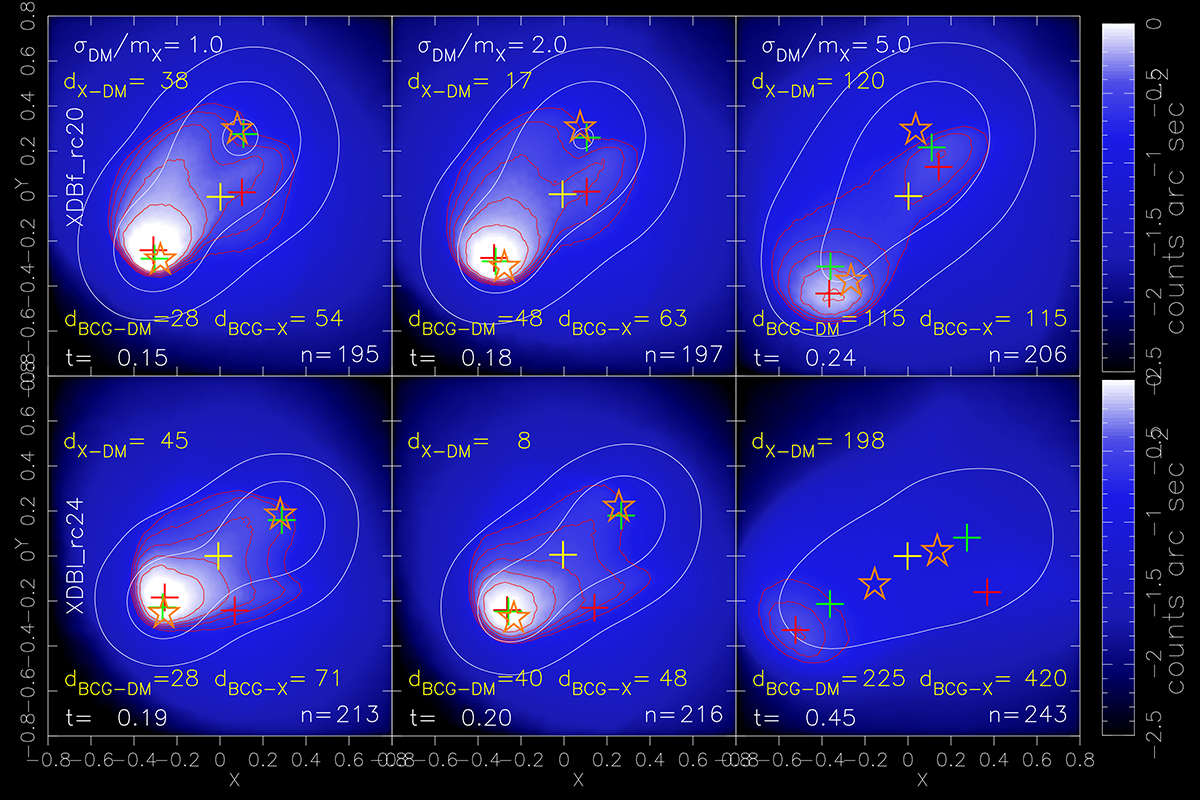
Fig. 11.
Download original image
X-ray surface brightness maps extracted at the present epoch, t, from two sets of SIDM merging runs. The simulations of the top (bottom) panels have the same initial conditions of model DBf_rc20 (DBl_rc24) of Fig. 10. From left to right each row of panels corresponds to SIDM simulations performed for three different values of the DM scattering cross-section: σDM/mX = 1, 2, and 5 cm2 gr−1, respectively. In each panel the distance dX-DM indicates the value in kpc of the projected distance between the X-ray emission peak and the DM mass centroid, dBCG-X that between the mass centroid of the BCG galaxy and the X-ray emission peak, and finally dBCG-DM is the distance between the BCG and DM mass centroids. All of the centroids refer to the SE cluster. The meaning of the other symbols is the same as in Fig. 10. The thresholds and the spacing of the contour levels are the same as those in Fig. 1. In each panel the value of n is the simulation step at which the map is extracted and t = 0 at the pericenter passage. The observer epoch is defined as in the other figures.
Current usage metrics show cumulative count of Article Views (full-text article views including HTML views, PDF and ePub downloads, according to the available data) and Abstracts Views on Vision4Press platform.
Data correspond to usage on the plateform after 2015. The current usage metrics is available 48-96 hours after online publication and is updated daily on week days.
Initial download of the metrics may take a while.