Fig. 10.
Download original image
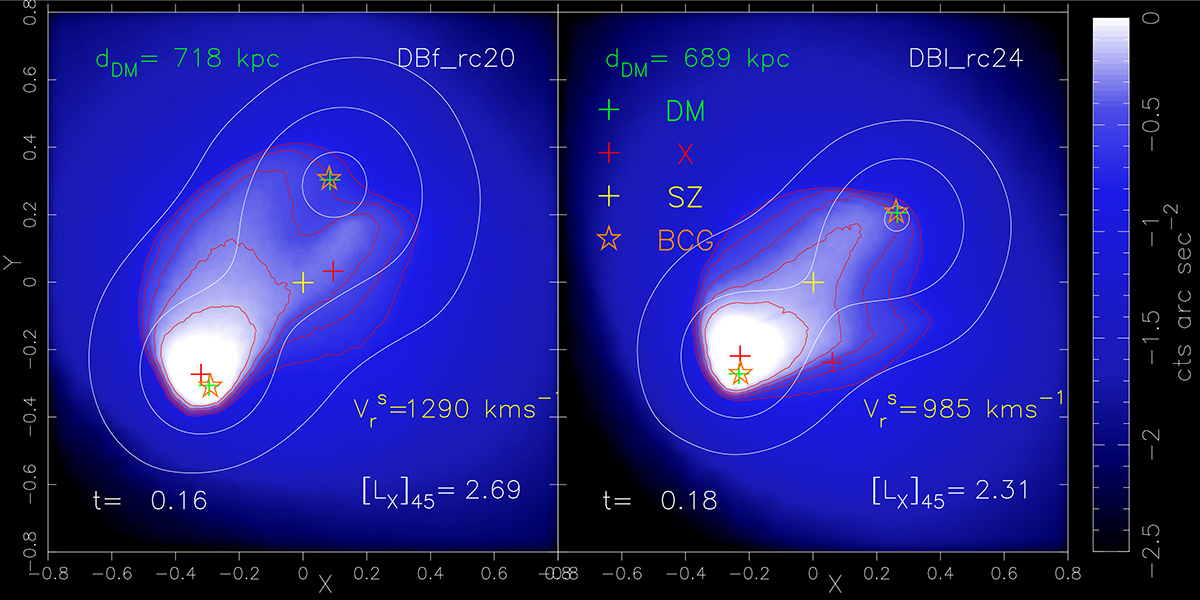
X-ray surface brightness images extracted from simulations of models DBf_rc20 and DBl_rc24. The merging parameters are the same as models Bf_rc20 and Bl_rc24, respectively, but the runs were performed with initial conditions including for the two clusters a stellar mass component describing a BCG (see Sect. 2.2.3). In each panel the open orange stars mark the projected spatial location of the mass centroids of the star particles representing the BCGs. The value of ![]() is relative mean radial velocity along the line of sight between the SE and NW BCG components. The meaning of the other symbols and the viewing direction is the same of the maps shown in Fig. 1.
is relative mean radial velocity along the line of sight between the SE and NW BCG components. The meaning of the other symbols and the viewing direction is the same of the maps shown in Fig. 1.
Current usage metrics show cumulative count of Article Views (full-text article views including HTML views, PDF and ePub downloads, according to the available data) and Abstracts Views on Vision4Press platform.
Data correspond to usage on the plateform after 2015. The current usage metrics is available 48-96 hours after online publication and is updated daily on week days.
Initial download of the metrics may take a while.