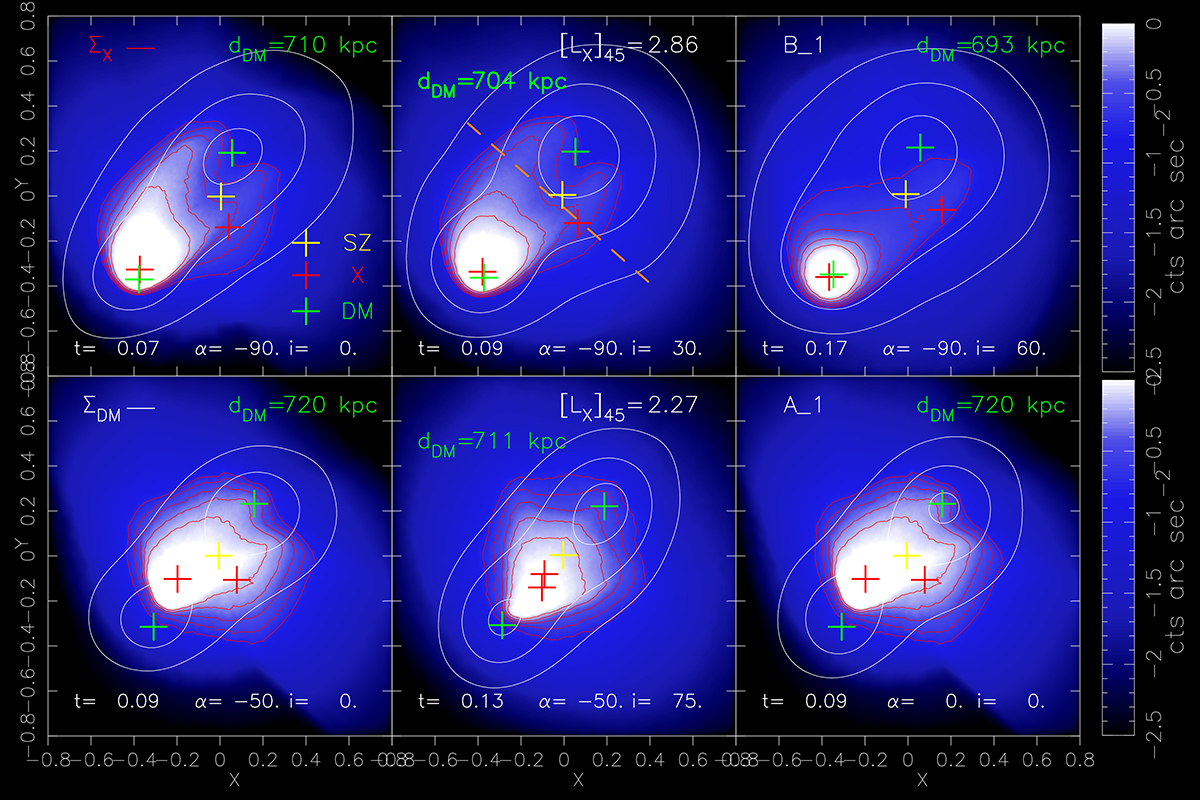
Fig. 1.
Download original image
X-ray surface brightness images extracted from simulations of models B_1 and A_1, for different viewing directions. The box size is 1.6 Mpc and time is in Gyr, with t = 0 at the pericenter passage. In each panel the epoch, t, is when the projected distance, dDM, between the mass centroids is approximately dDM ∼ 700 kpc; the orientation angles {α, i} of the merging plane are defined in Sect. 2.4. In each panel the log-spaced contour levels of the projected X-ray surface brightness (red) and mass density (white) are overlaid. From the inside to outside, the contour levels of the X-ray surface brightness and of the surface mass density are: (6.6, 4.4, 2.9, 1.9, 1.2) × 10−1 counts arcsec−2 and (5.6, 3.1, 1.8) × 10−1 gr cm−2. The crosses indicate the projected spatial locations of the mass (green) and X-ray surface brightness (red) centroids; the yellow cross shows the position of the SZ centroid. The maps can be directly compared with Figs. 1 and 3 of ZYL15, the orientation along the viewing direction of the merging plane in the sky being the same. In particular, the mid panels of models A_1 and B_1 correspond to the fiducial models A and B of ZYL15 (see their Table 2). For these models, the X-ray luminosity in the 0.5 − 2 keV band is given in units of 1045 ergs−1. For the fiducial model B_1 (top mid panel), the dashed orange line shows the location and orientation of the spatial region used to extract the X-ray surface brightness profile. This model is chosen as the baseline model of the simulations.
Current usage metrics show cumulative count of Article Views (full-text article views including HTML views, PDF and ePub downloads, according to the available data) and Abstracts Views on Vision4Press platform.
Data correspond to usage on the plateform after 2015. The current usage metrics is available 48-96 hours after online publication and is updated daily on week days.
Initial download of the metrics may take a while.