Fig. 6.
Download original image
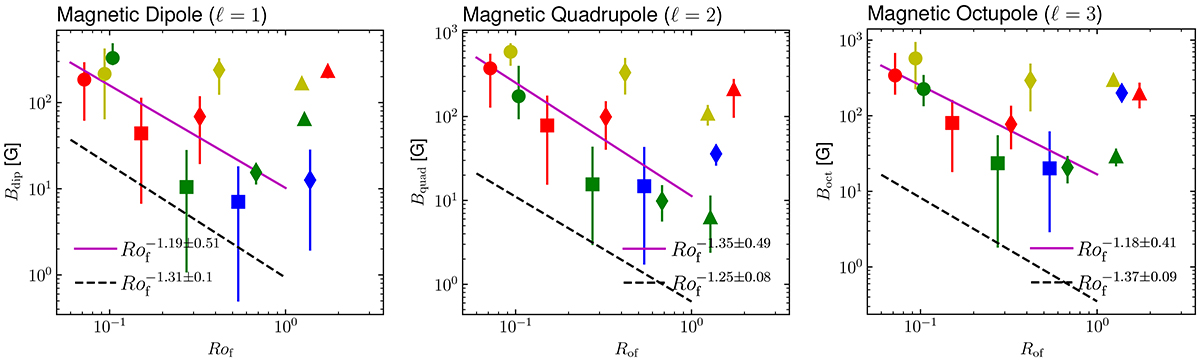
Multipolar decomposition of the magnetic field near the surface (with m components summed quadratically), showing the dipole, ℓ = 1 (left), quadrupole, ℓ = 2 (middle), and octupole, ℓ = 3 (right), as a function of the Rossby number, Rof. At low Rof, the agreement between the simulations (purple line) and observational (dashed black line) fits is quantitatively good for all low-degree dynamo modes, with all modes showing a decreasing trend and power laws comparable to observations. The possible inverse trend for high Rossby numbers is also found in all three multipoles. Symbols have the same meanings as in Fig. 5.
Current usage metrics show cumulative count of Article Views (full-text article views including HTML views, PDF and ePub downloads, according to the available data) and Abstracts Views on Vision4Press platform.
Data correspond to usage on the plateform after 2015. The current usage metrics is available 48-96 hours after online publication and is updated daily on week days.
Initial download of the metrics may take a while.