Fig. 4.
Download original image
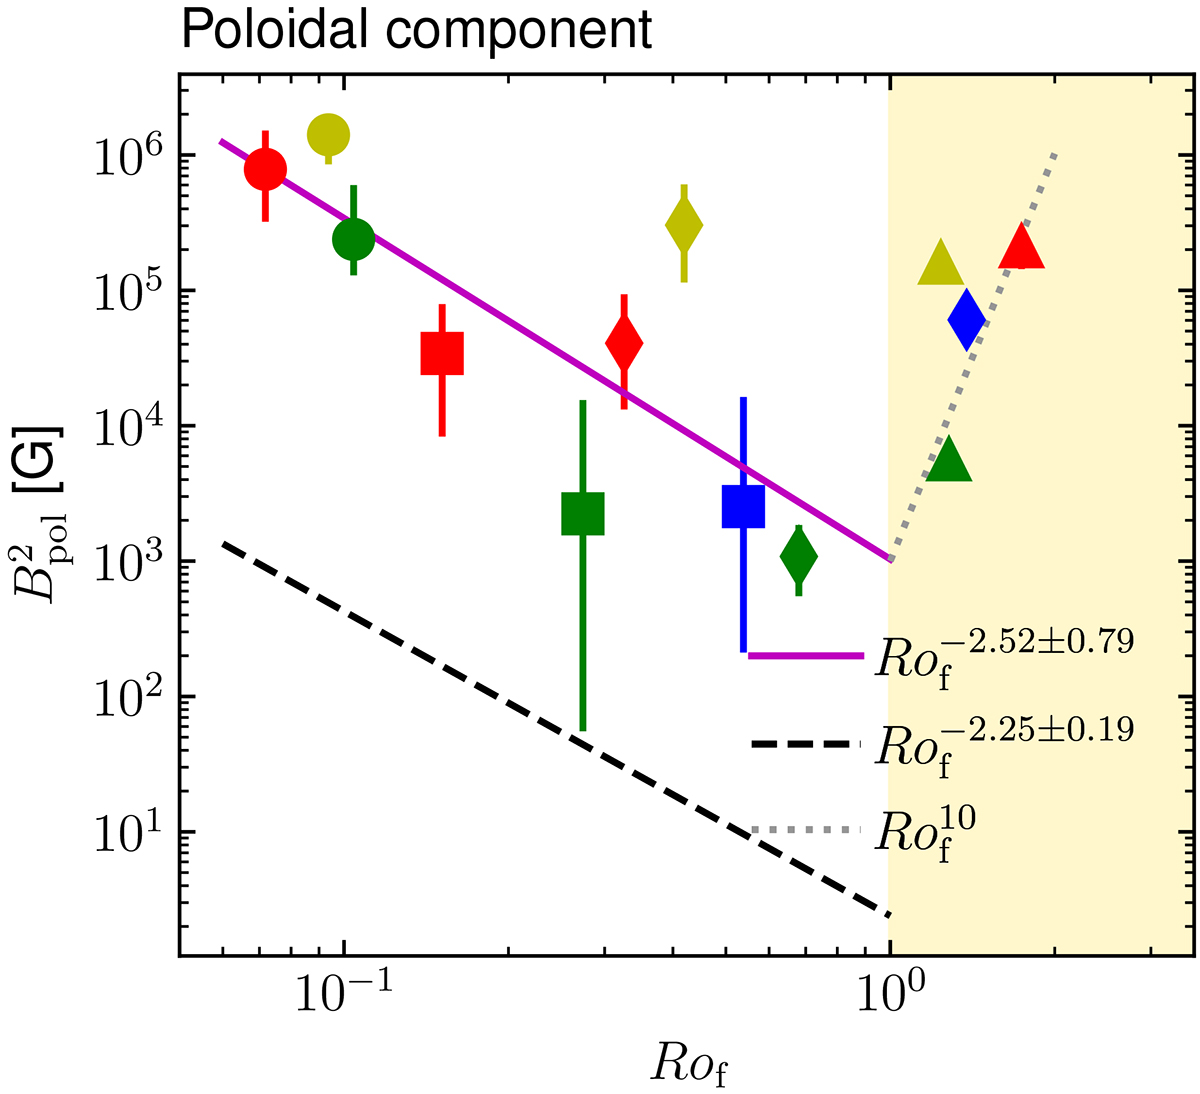
Poloidal field component squared amplitude as a function of the Rossby number, Rof. At low Rof, the agreement between the simulations (purple line) and observation (dashed black line) is quantitatively good, with both showing a similar decreasing trend. At a higher Rossby number, Rof > 1 (yellow range), not covered by the observational database, an inverse trend is indicated by the simulations, and hence suggests a minimum in poloidal field strength near Rof ∼ 1, which could have interesting consequences for stellar spin-down via wind braking. An indicative trend proportional to ![]() is shown using a dotted grey line. We note the V shape that the two trends (purple and dotted lines) form, with the minimum being near Rof ∼ 1. The coloured symbols have the same meanings as in Fig. 3.
is shown using a dotted grey line. We note the V shape that the two trends (purple and dotted lines) form, with the minimum being near Rof ∼ 1. The coloured symbols have the same meanings as in Fig. 3.
Current usage metrics show cumulative count of Article Views (full-text article views including HTML views, PDF and ePub downloads, according to the available data) and Abstracts Views on Vision4Press platform.
Data correspond to usage on the plateform after 2015. The current usage metrics is available 48-96 hours after online publication and is updated daily on week days.
Initial download of the metrics may take a while.