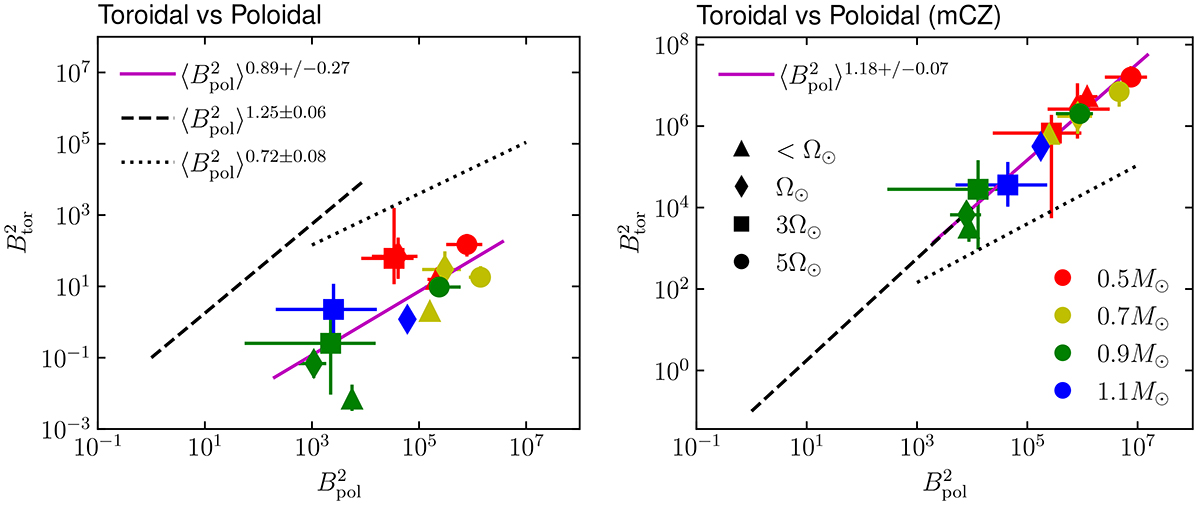
Fig. 3.
Download original image
Left: magnetic ratio between the squared toroidal, Btor, and poloidal, Bpol, components near the surface. Two observational fits (dashed black for M > 0.5 M⊙ and dotted lines for M < 0.5 M⊙) from See et al. (2015) are indicated, as well as the fit of the simulations (purple line) and their respective error bars. Right: same ratio within the convective envelope. The coloured symbols have the following meanings: red, yellow, green, and blue represent stars with 0.5, 0.7, 0.9, and 1.1 M⊙, respectively, and triangle, diamond, square, and filled circle shapes the rotation rates for, respectively, slow (the exact value depends on mass see Brun et al. 2022), one, three, and five times the solar rotation rate, Ω⊙. The error bars indicate the minimum and maximum values reached by the model during the integrated time (one or several cycle periods) used to compute the mean value indicated by the symbol.
Current usage metrics show cumulative count of Article Views (full-text article views including HTML views, PDF and ePub downloads, according to the available data) and Abstracts Views on Vision4Press platform.
Data correspond to usage on the plateform after 2015. The current usage metrics is available 48-96 hours after online publication and is updated daily on week days.
Initial download of the metrics may take a while.