Fig. 2.
Download original image
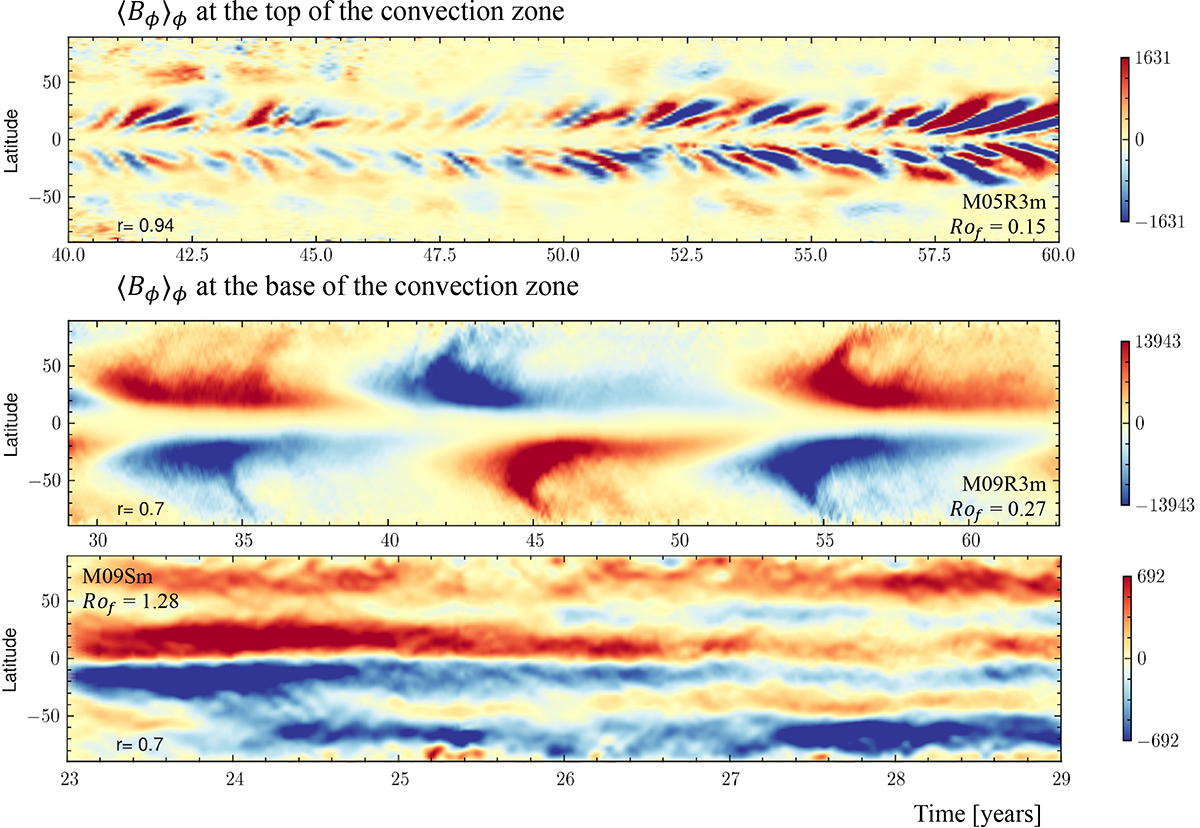
Typical magnetic butterfly diagrams (i.e., time–latitude diagram of the axisymmetric toroidal magnetic field) achieved in the simulations published in Brun et al. (2022). On the top panel, the butterfly diagram is shown as a colour contour plot in Gauss for the rapidly rotating cases (low Rossby numbers), in the middle panel for intermediate value (Sun-like) and in the bottom panel for statistically steady solutions for slowly rotating stars with large Rossby numbers.
Current usage metrics show cumulative count of Article Views (full-text article views including HTML views, PDF and ePub downloads, according to the available data) and Abstracts Views on Vision4Press platform.
Data correspond to usage on the plateform after 2015. The current usage metrics is available 48-96 hours after online publication and is updated daily on week days.
Initial download of the metrics may take a while.