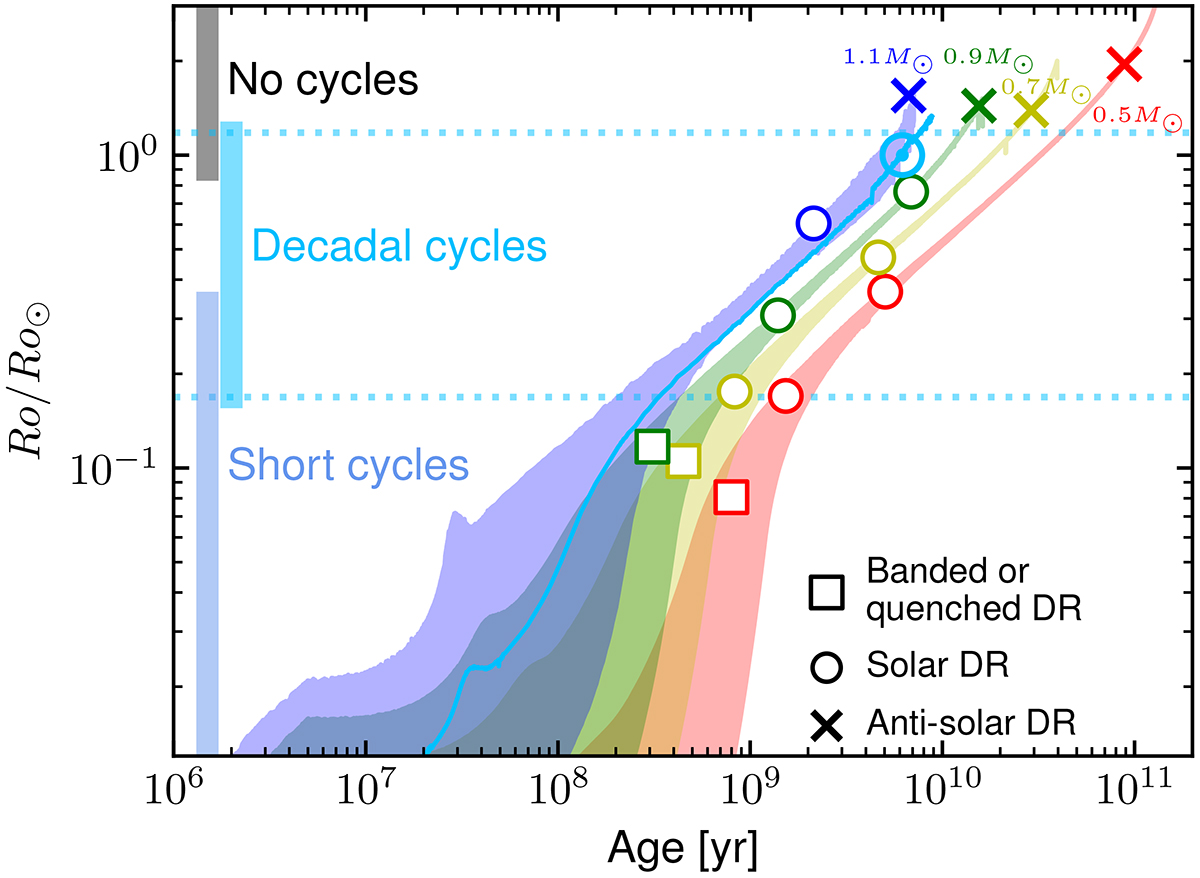
Fig. 1.
Download original image
Stellar evolutionary tracks in a Rossby vs. age diagram. Shown on the figure are, 1D evolutionary track from Amard & Matt (2020) as a colour shaded envelope taking into account the initial rotational spread. The particular case of the solar track is shown in cyan colour. Symbols represent the ASH simulations and are changed according to the internal differential rotation profile achieved in the convective envelope of the simulations, either banded/quenched, solar like (fast equator slow poles) and anti-solar (slow equator fast poles). The coloured vertical bars on the left represent the magnetic states either short, decadal and no cycles.
Current usage metrics show cumulative count of Article Views (full-text article views including HTML views, PDF and ePub downloads, according to the available data) and Abstracts Views on Vision4Press platform.
Data correspond to usage on the plateform after 2015. The current usage metrics is available 48-96 hours after online publication and is updated daily on week days.
Initial download of the metrics may take a while.