Fig. 4.
Download original image
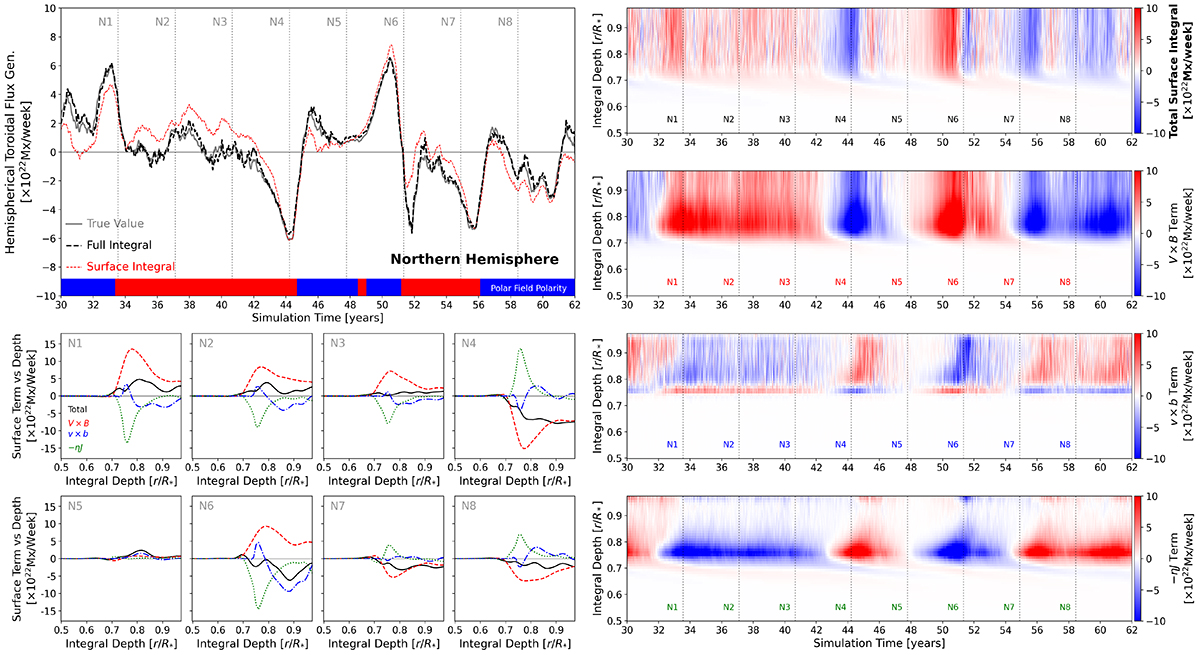
Comparison of the net toroidal flux generation in the northern hemisphere of the ASH simulation. The upper left panel shows the time evolution of the net toroidal flux generation with the true value in solid grey, the full line integral in dashed black, and the surface line integral only in dotted red. The true value and line integral agree, with small differences due to the data sampling frequency (here data are taken at a weekly cadence rather than at the much smaller time-step cadence). Intervals labelled with vertical lines from one to eight, correspond to the smaller panels below. These panels show, for each interval, the depth dependence of the surface line integral, and its constituents (the large-scale flows, the fluctuating flows, and magnetic diffusion). The series of panels on the right contain a more continuous sampling of this parameter space, showing the time-evolving depth dependence of the surface line integral and its contributions. Above ∼0.75 stellar radii, the line integral remains roughly constant with depth. Figure B.1 shows the same information but for the southern hemisphere.
Current usage metrics show cumulative count of Article Views (full-text article views including HTML views, PDF and ePub downloads, according to the available data) and Abstracts Views on Vision4Press platform.
Data correspond to usage on the plateform after 2015. The current usage metrics is available 48-96 hours after online publication and is updated daily on week days.
Initial download of the metrics may take a while.