Fig. 2.
Download original image
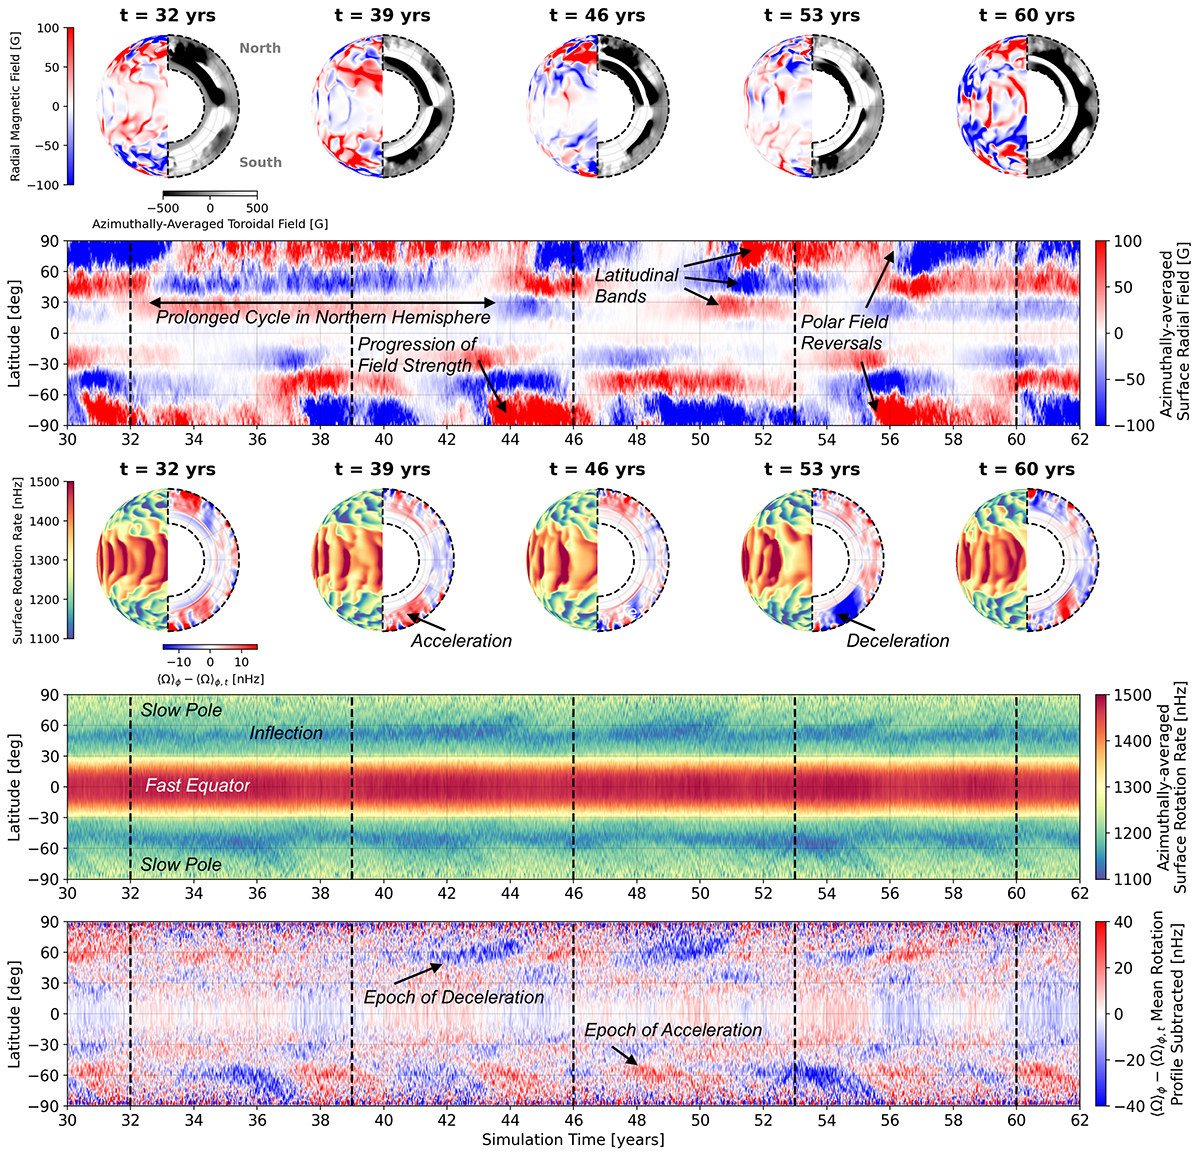
Overview of the ASH simulation used in this work. Snapshots of the simulation at five intervals are displayed in the top row, showing the radial field at the surface in the left hemisphere and the azimuthally averaged toroidal flux in the right hemisphere. The second panel shows the time evolution of the azimuthally averaged radial magnetic field at the surface. The third row contains snapshots, similar to the top row, displaying the surface rotation rate in the left hemisphere and the azimuthally averaged rotation rate (minus the time-averaged profile) in the right hemisphere. The fourth panel shows the time evolution of the azimuthally averaged surface rotation rate, with the fifth panel containing the residual rotation rate after the temporal average is subtracted (highlighting deviations coincident with the reversal of the radial magnetic field).
Current usage metrics show cumulative count of Article Views (full-text article views including HTML views, PDF and ePub downloads, according to the available data) and Abstracts Views on Vision4Press platform.
Data correspond to usage on the plateform after 2015. The current usage metrics is available 48-96 hours after online publication and is updated daily on week days.
Initial download of the metrics may take a while.