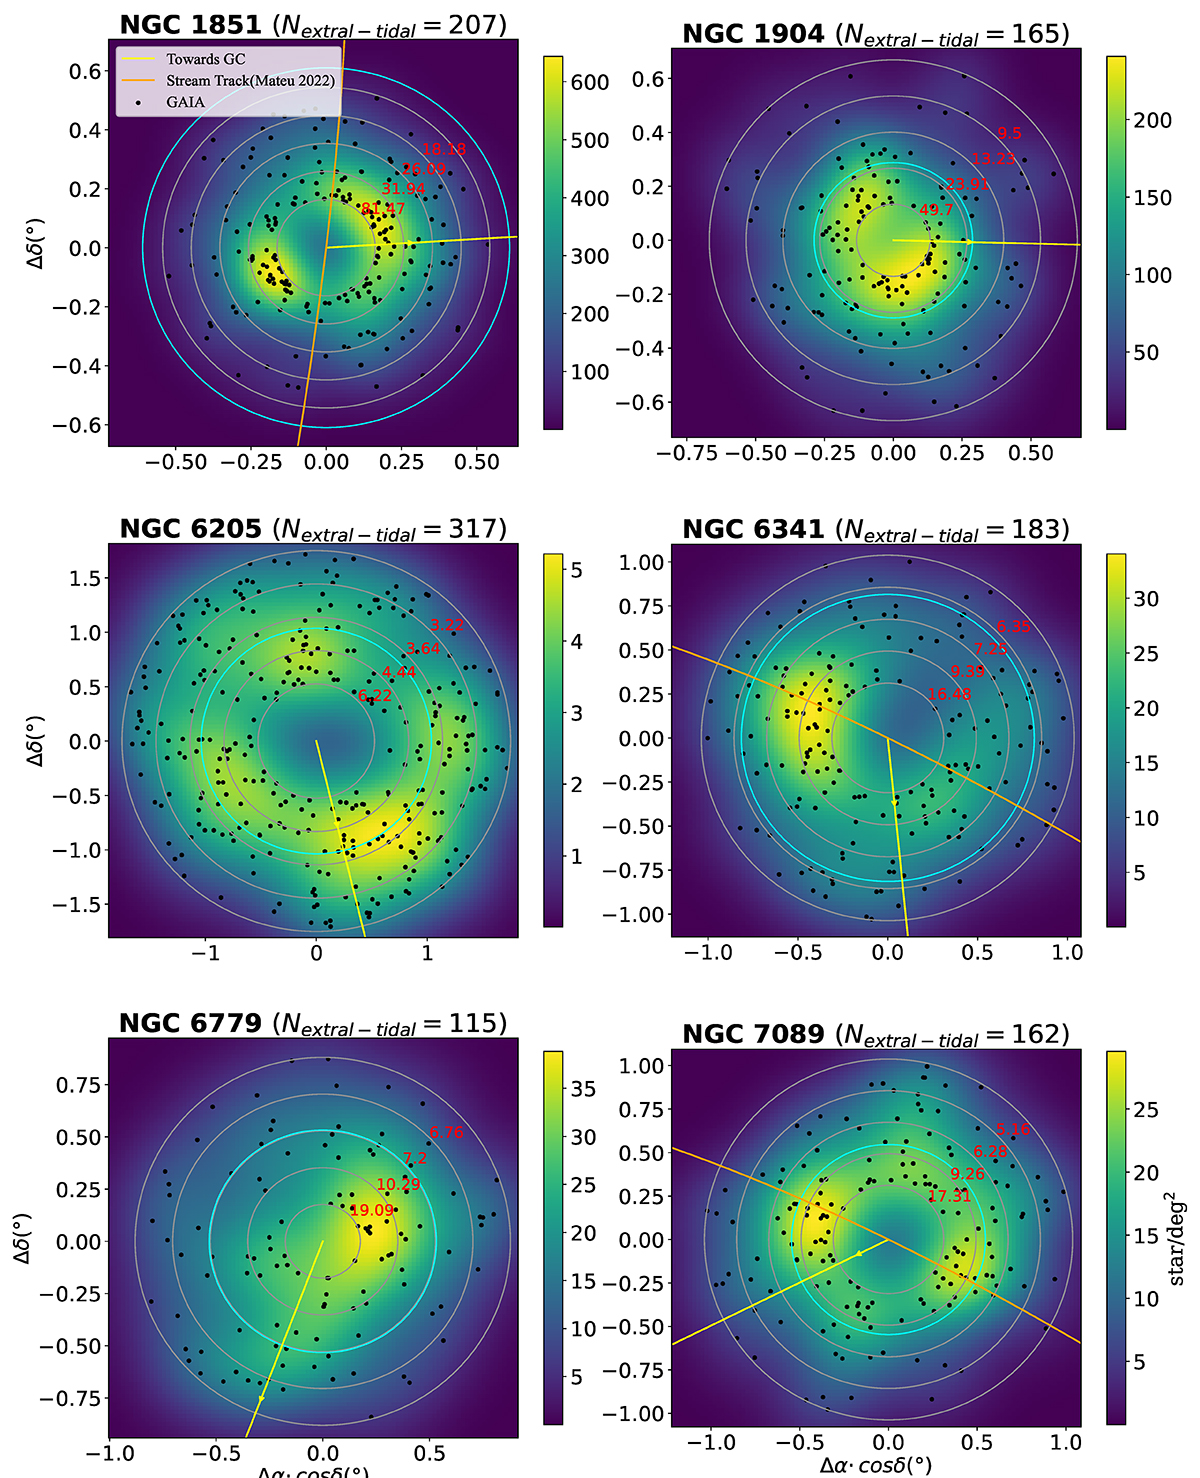
Fig. 5.
Download original image
Density map of extra-tidal candidates for six GCs. The spatial density of extra-tidal candidates (black dots) are indicated by their colors. The yellow line represents the direction pointing toward the Galactic center, while the orange line represents the stream track provided by Mateu (2023) with a parallel shift to make sure that the track goes through the cluster center. The gray circles represent the selected range, where the innermost gray circle represents the tidal radius, the outermost gray circle represents five times the tidal radius, and the blue circle represents the Jacobi radius. The average radial Poisson noise is calculated in four regions, and the values are indicated by the red text.
Current usage metrics show cumulative count of Article Views (full-text article views including HTML views, PDF and ePub downloads, according to the available data) and Abstracts Views on Vision4Press platform.
Data correspond to usage on the plateform after 2015. The current usage metrics is available 48-96 hours after online publication and is updated daily on week days.
Initial download of the metrics may take a while.