Fig. 4.
Download original image
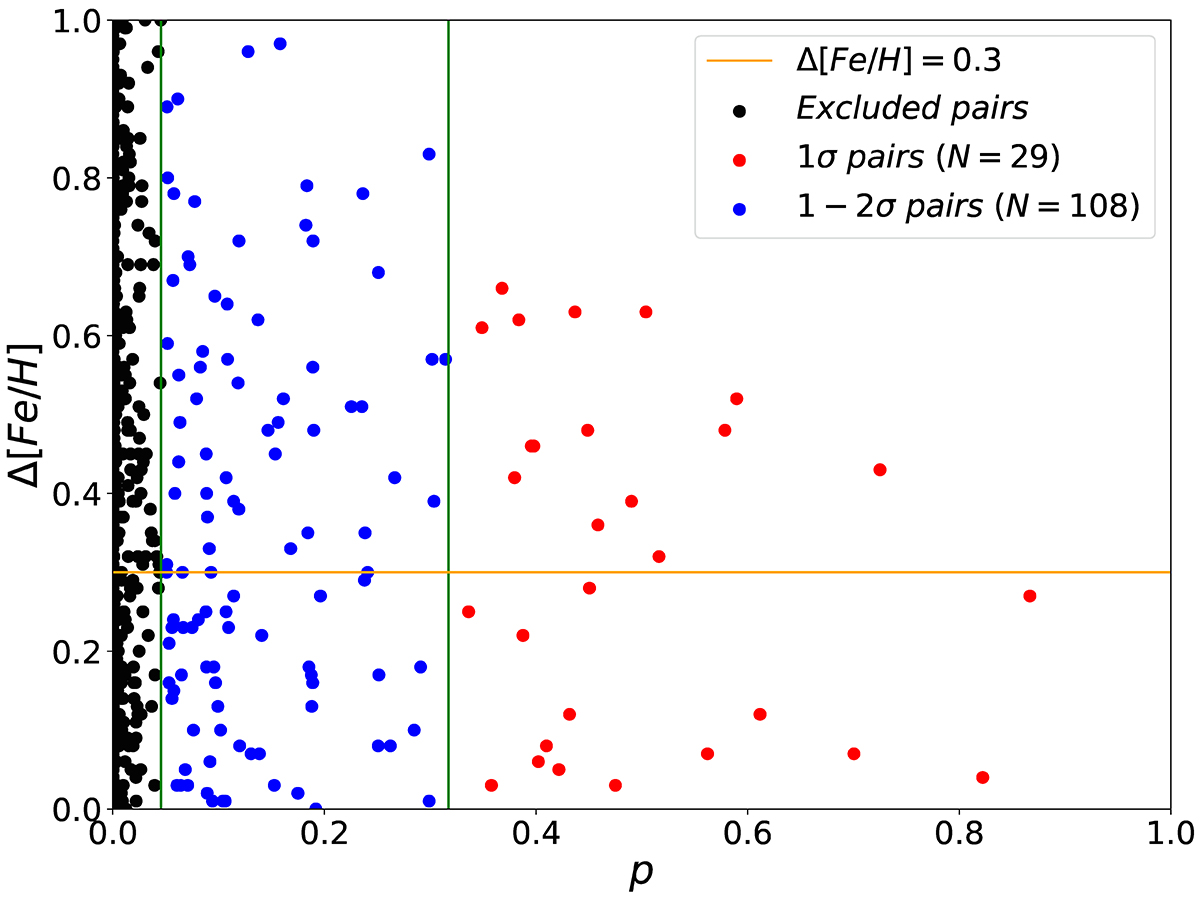
For each GC–star pair, confidence level p for the pair against absolute difference in metallicity. The green lines indicate the 0.05 (1σ) and 0.32 (2σ) confidence levels. The yellow line represents an absolute difference in metallicity of 0.3. The blue dots represent pairs with a confidence between 0.05 and 0.32, while the orange dots represent pairs with a confidence greater than 0.32. The most probable pair is represented by the red dots in the bottom right region.
Current usage metrics show cumulative count of Article Views (full-text article views including HTML views, PDF and ePub downloads, according to the available data) and Abstracts Views on Vision4Press platform.
Data correspond to usage on the plateform after 2015. The current usage metrics is available 48-96 hours after online publication and is updated daily on week days.
Initial download of the metrics may take a while.