Open Access
Fig. 2.
Download original image
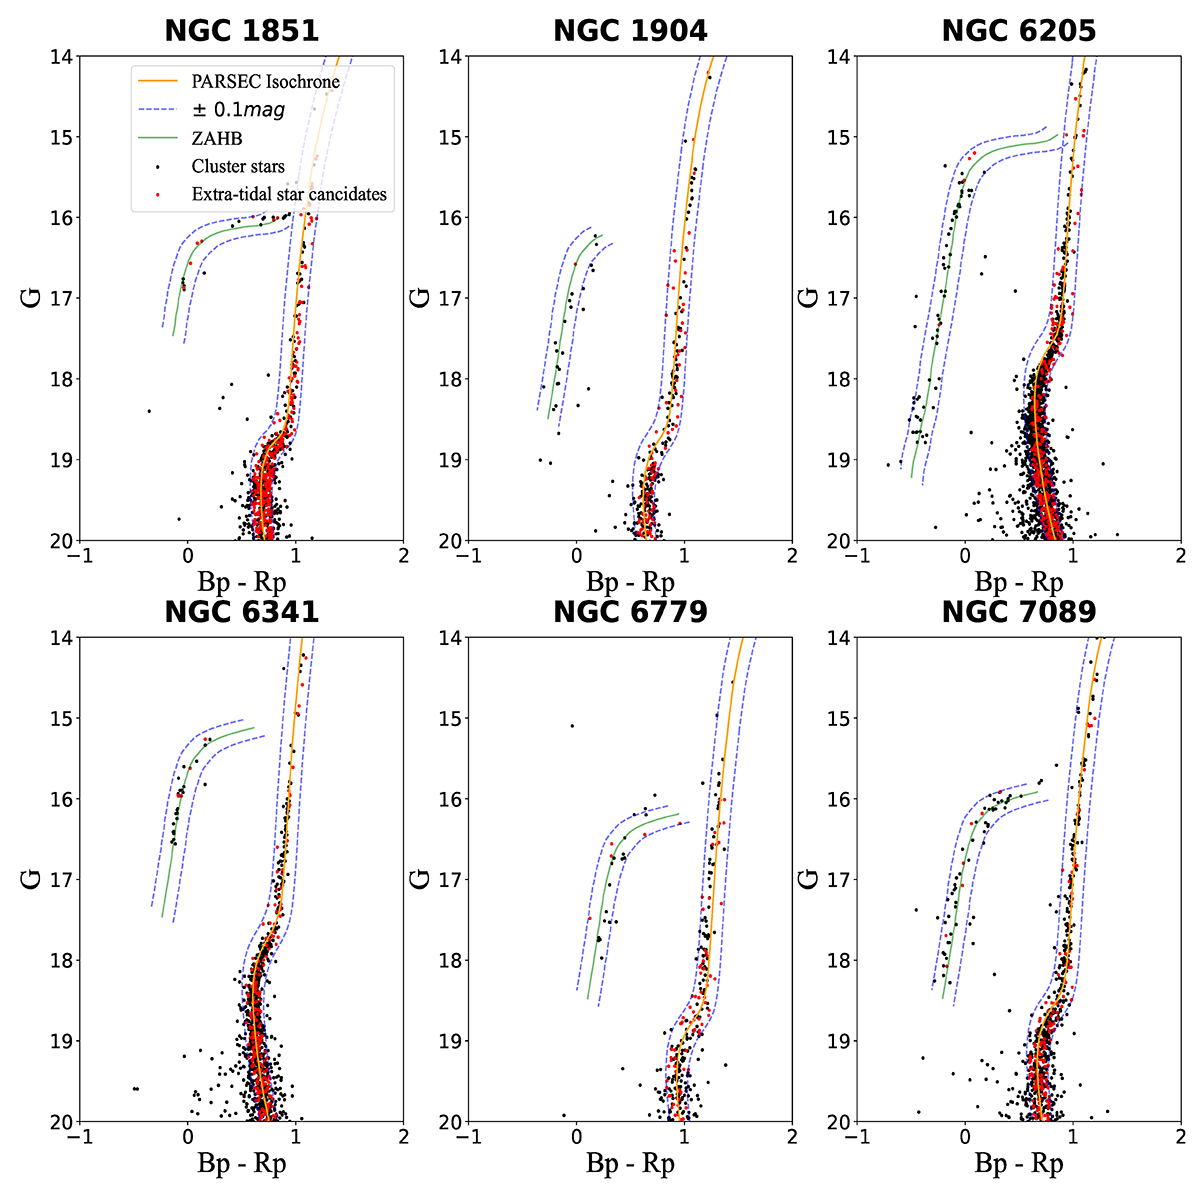
Gaia EDR3 de-reddened CMD of the six GCs, with the PARSEC isochrones (solid orange lines). The ZAHB is drawn with green lines (see text for details), the red dots are the selected extra-tidal candidates, the black dots are the stars inside 1 rt, and the blue dashed line is the boundary for selecting extra-tidal candidates.
Current usage metrics show cumulative count of Article Views (full-text article views including HTML views, PDF and ePub downloads, according to the available data) and Abstracts Views on Vision4Press platform.
Data correspond to usage on the plateform after 2015. The current usage metrics is available 48-96 hours after online publication and is updated daily on week days.
Initial download of the metrics may take a while.