Open Access
Fig. 1.
Download original image
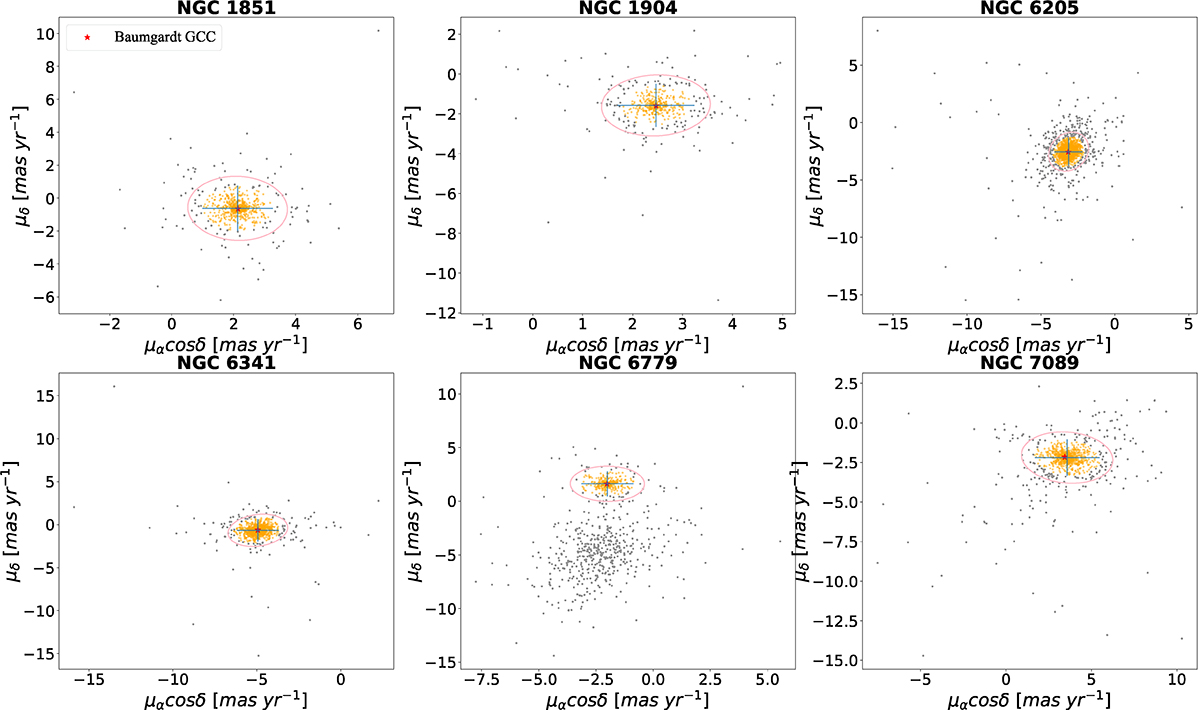
PM distribution with its ±3σ regions (blue lines, including 99.7% of the sample stars) of each cluster, determined as the GMM fit of the cluster stars within 1 rt (orange dot), as well as the field population (gray dots). The red star in each panel represents the mean PM of clusters obtained by Baumgardt & Vasiliev (2021).
Current usage metrics show cumulative count of Article Views (full-text article views including HTML views, PDF and ePub downloads, according to the available data) and Abstracts Views on Vision4Press platform.
Data correspond to usage on the plateform after 2015. The current usage metrics is available 48-96 hours after online publication and is updated daily on week days.
Initial download of the metrics may take a while.