Fig. 5
Download original image
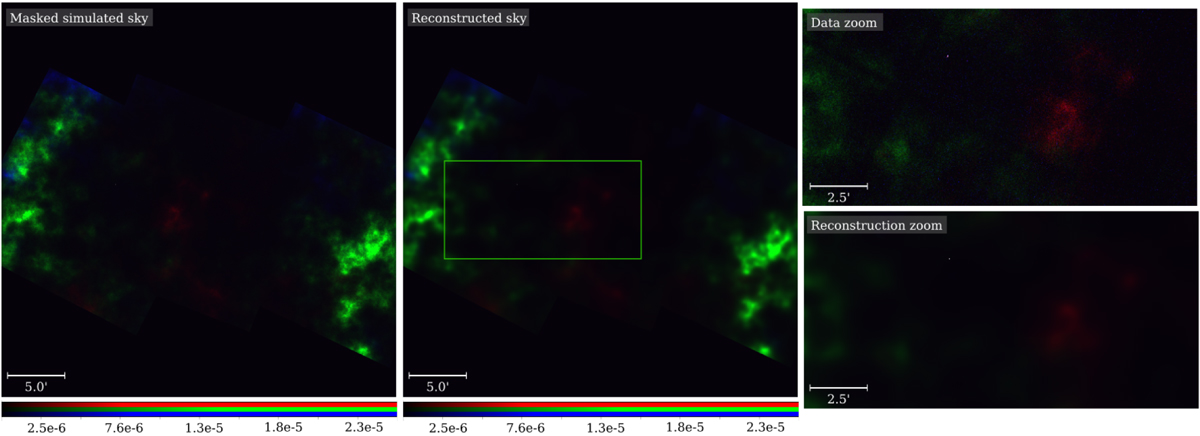
Reconstruction results on synthetic data. Left: sky sample generated for this study masked by the extent of the exposure patches (14423, 14424, 14435; see Table 3). Center: reconstruction result, i.e., the posterior mean, of the imaged sky masked by the extent of the same exposure patches. Right: zoomed-in regions of the data on top and of the reconstructed image below. The shown cutout region is marked in the center image.
Current usage metrics show cumulative count of Article Views (full-text article views including HTML views, PDF and ePub downloads, according to the available data) and Abstracts Views on Vision4Press platform.
Data correspond to usage on the plateform after 2015. The current usage metrics is available 48-96 hours after online publication and is updated daily on week days.
Initial download of the metrics may take a while.