Fig. 4
Download original image
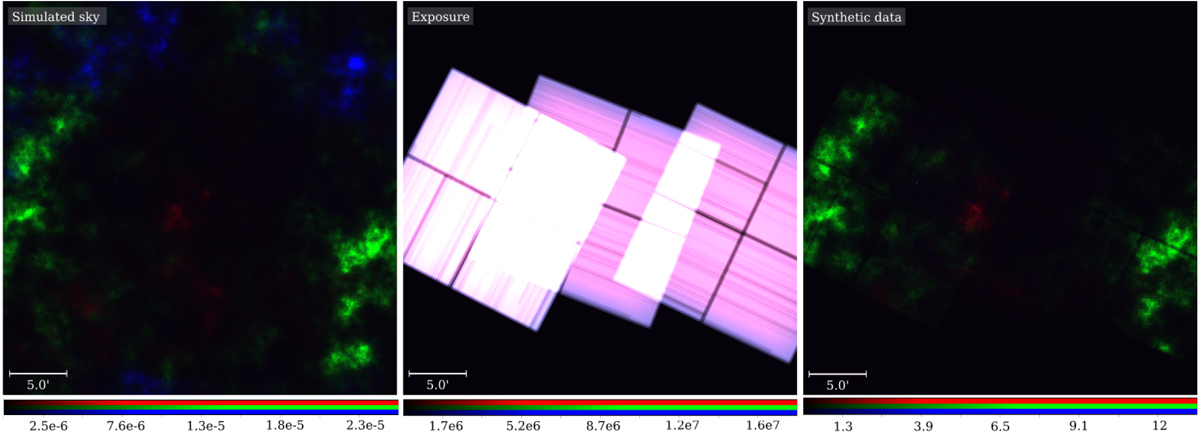
Generation of synthetic data. Left: sky sample generated for the validation experiment. Center: Chandra exposure, modeled by combining three patches (14423, 14424, 14435; see Table 3). Right: synthetic data corresponding to the sky sample, obtained by convolving the sky sample with the PSF and drawing a pixel-wise Poisson sample from the resulting detector flux prediction.
Current usage metrics show cumulative count of Article Views (full-text article views including HTML views, PDF and ePub downloads, according to the available data) and Abstracts Views on Vision4Press platform.
Data correspond to usage on the plateform after 2015. The current usage metrics is available 48-96 hours after online publication and is updated daily on week days.
Initial download of the metrics may take a while.