Fig. B.1
Download original image
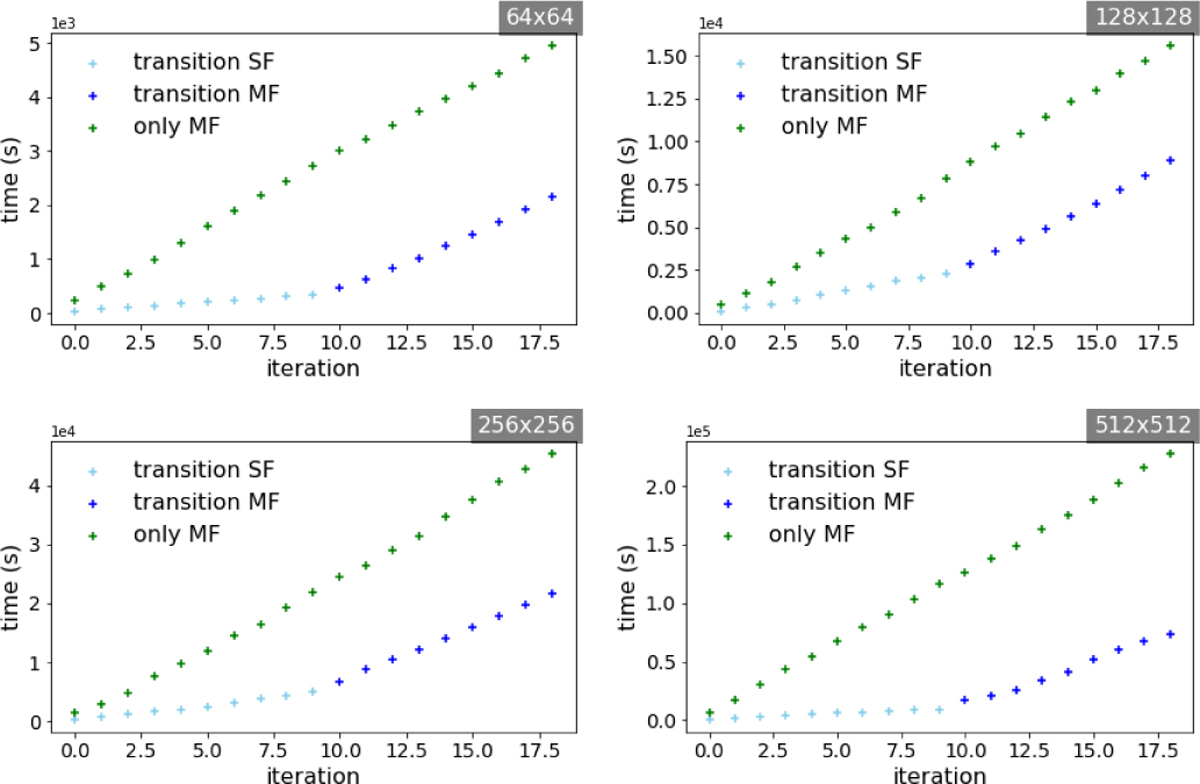
Time complexity (top-left: 64 × 64 spatial pixels; top-right: 128 × 128 spatial pixels; bottom-left: 256 × 256 spatial pixels; bottom-right: 512 × 512 spatial pixels). The time complexity is plotted for the different models. In green, we show just the MF reconstruction times per iteration. Light blue: duration for each iteration in the SF model before the transition. Dark blue: duration of the MF model iterations after the transition. The first dark blue marker also includes the transition time.
Current usage metrics show cumulative count of Article Views (full-text article views including HTML views, PDF and ePub downloads, according to the available data) and Abstracts Views on Vision4Press platform.
Data correspond to usage on the plateform after 2015. The current usage metrics is available 48-96 hours after online publication and is updated daily on week days.
Initial download of the metrics may take a while.