Fig. 12
Download original image
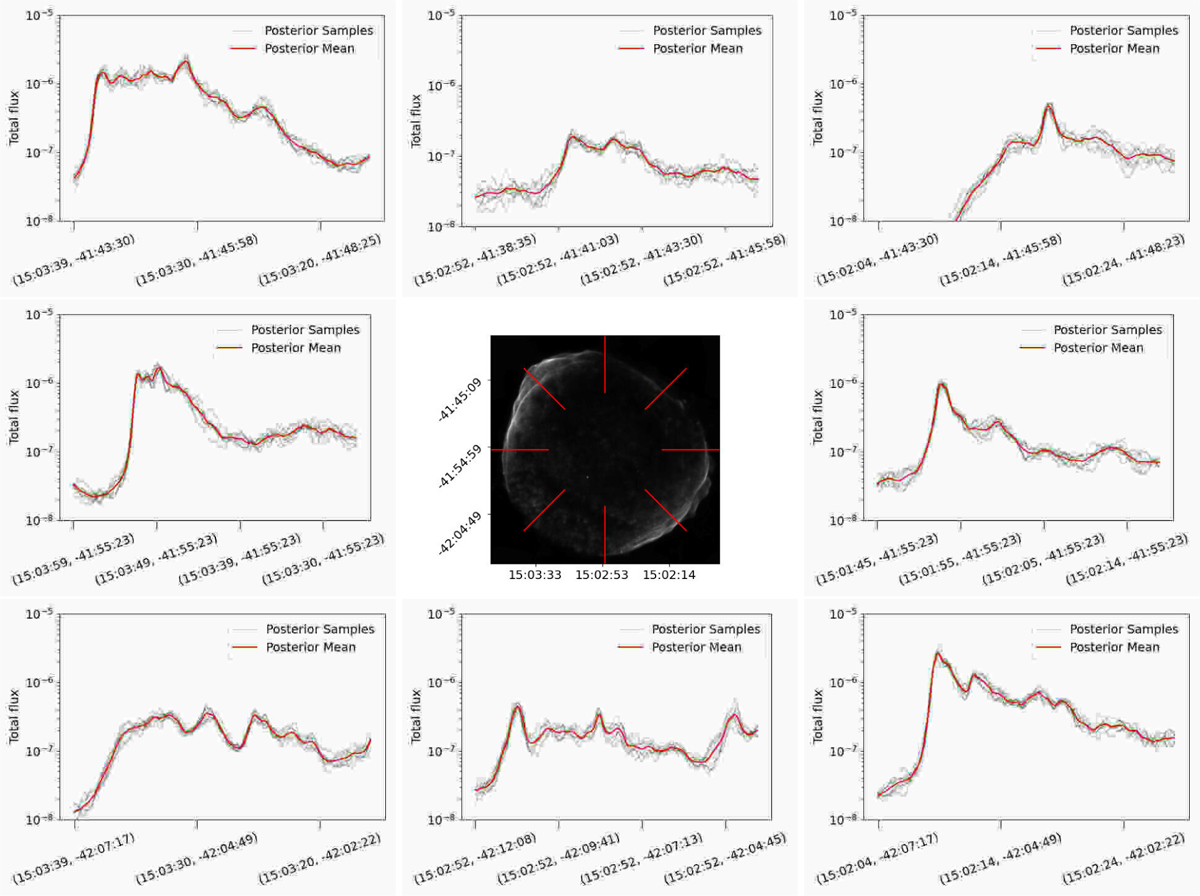
Flux intensity profiles in [s−1 cm−2]. The center image shows the location of the lines along which we present the intensity profile in pixel coordinates. The corresponding intensity profiles are plotted next to the line. The posterior mean of the reconstructed flux is plotted in red and the corresponding posterior samples are plotted in grey. The profiles are shown from left to right from the outsides to the insides of the SNR.
Current usage metrics show cumulative count of Article Views (full-text article views including HTML views, PDF and ePub downloads, according to the available data) and Abstracts Views on Vision4Press platform.
Data correspond to usage on the plateform after 2015. The current usage metrics is available 48-96 hours after online publication and is updated daily on week days.
Initial download of the metrics may take a while.