Open Access
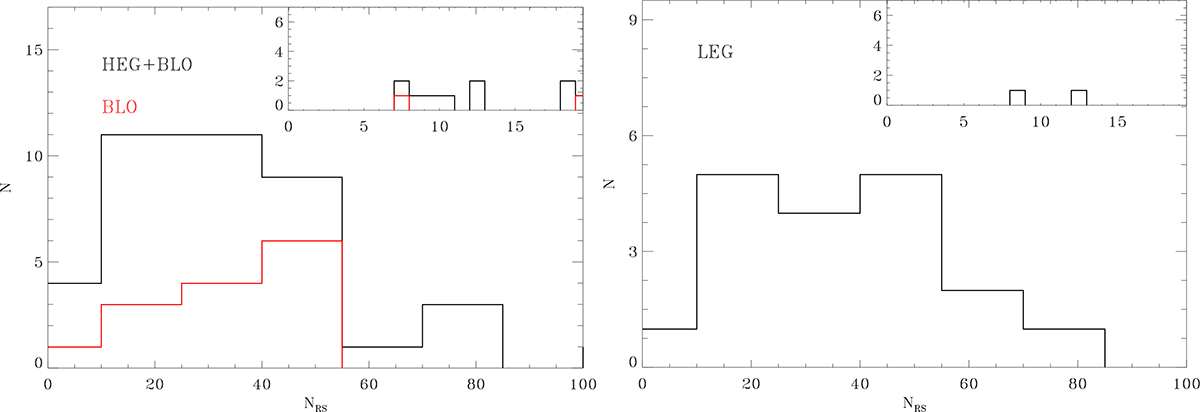
Fig. 6.
Download original image
Histograms showing the distribution of the number of RS objects for the HEGs and BLOs (left panel) and LEGs (right panel). The insets show an enlargement of the same distributions with a smaller bin size. The magnitude cut used is Mr = −17, while the RS dispersion is 0.312.
Current usage metrics show cumulative count of Article Views (full-text article views including HTML views, PDF and ePub downloads, according to the available data) and Abstracts Views on Vision4Press platform.
Data correspond to usage on the plateform after 2015. The current usage metrics is available 48-96 hours after online publication and is updated daily on week days.
Initial download of the metrics may take a while.