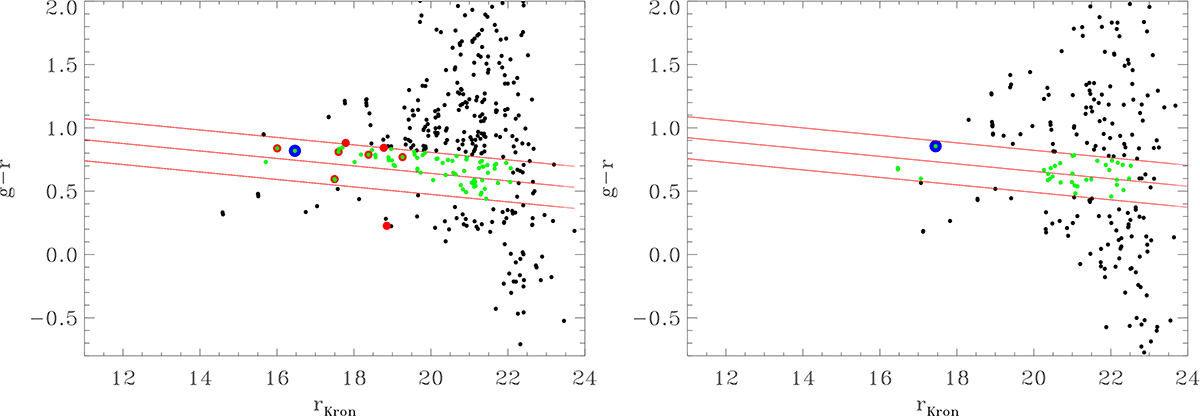
Fig. 1.
Download original image
Left panel: CMD of the source 3CR 089. The blue dot represents the host of 3C 089; the red dots are the spectroscopic companions identified through SDSS data; the red lines represent the boundaries of the RS from O’Mill et al. (2019); and the green dots are the sources falling inside the RS with absolute magnitude Mr < −17. Right panel: CMD of the source 3CR 063. The RS in this source is less clearly defined.
Current usage metrics show cumulative count of Article Views (full-text article views including HTML views, PDF and ePub downloads, according to the available data) and Abstracts Views on Vision4Press platform.
Data correspond to usage on the plateform after 2015. The current usage metrics is available 48-96 hours after online publication and is updated daily on week days.
Initial download of the metrics may take a while.