Fig. 6
Download original image
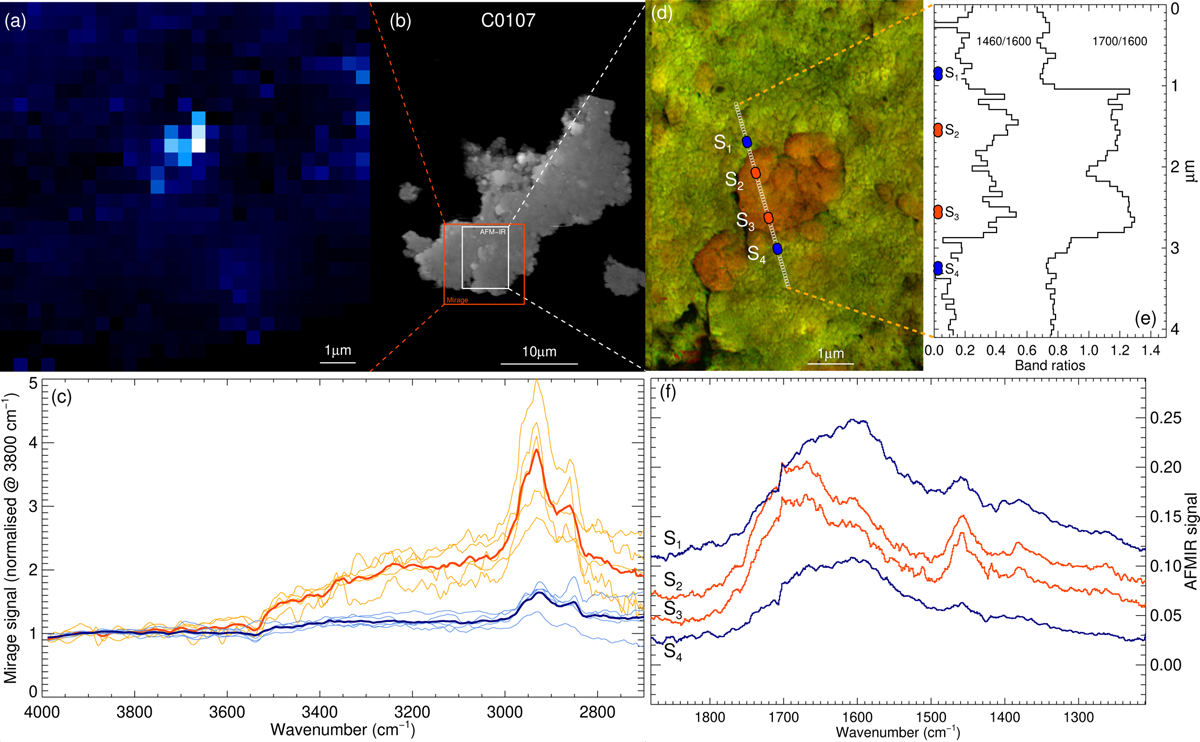
Ryugu IOM sample C0107-IOM residue_16-A. Zoom-in on a region including the organic nanoparticle assemblage identified in situ in Fig. 5. These organic nanoparticles were both analyzed with the O-PTIR technique using a mIRage® and with AFM-IR. (a) Projected IR map integrating the CHX stretching mode absorption band over the 3050–2750 cm−1 range from the mIRage® analysis (lateral resolution of 500 nm). (b) Large-scale topographic map of the grain and the location of the analyses by O-PTIR (red box corresponding to the map in (a)) and AFM-IR (white box corresponding to the maps shown in (d). (c) Spectra from the hyperspectral mapping over the organic nanoparticle region using O-PTIR. Individual spectra on the organic nanoparticles (in red) show a higher absorption in the CHX region (average spectra in bold curve). The blue spectra are from the neighboring areas and show lower CHX absorption (average spectrum in bold blue curve). (d) RGB image of the region including the nanoglobule (C=O at 1720 cm−1 in red, C=C at 1600 cm−1 in green, CHX 1460 cm−1 minus 1520 cm−1 in blue). The white line shows the location of individual AFM-IR spectra taken across the nanoglobule assemblage. The colored dots (S1 to S4) correspond to average spectra taken on each side (S1 and S4 in blue) and on the organic nanoparticles (S2 and S3 in red). (e) Intensity ratios of frequencies corresponding to CHX/C=C (1460/1600) and C=O/C=C (1700/1600) along the white line shown in (d). The location of the S1 to S4 spectra is recalled on the left axis. (f) Average AFM-IR spectra on each side (blue, S1 and S4) and on the organic nanoparticles (red, S2 and S3).
Current usage metrics show cumulative count of Article Views (full-text article views including HTML views, PDF and ePub downloads, according to the available data) and Abstracts Views on Vision4Press platform.
Data correspond to usage on the plateform after 2015. The current usage metrics is available 48-96 hours after online publication and is updated daily on week days.
Initial download of the metrics may take a while.