Fig. 4
Download original image
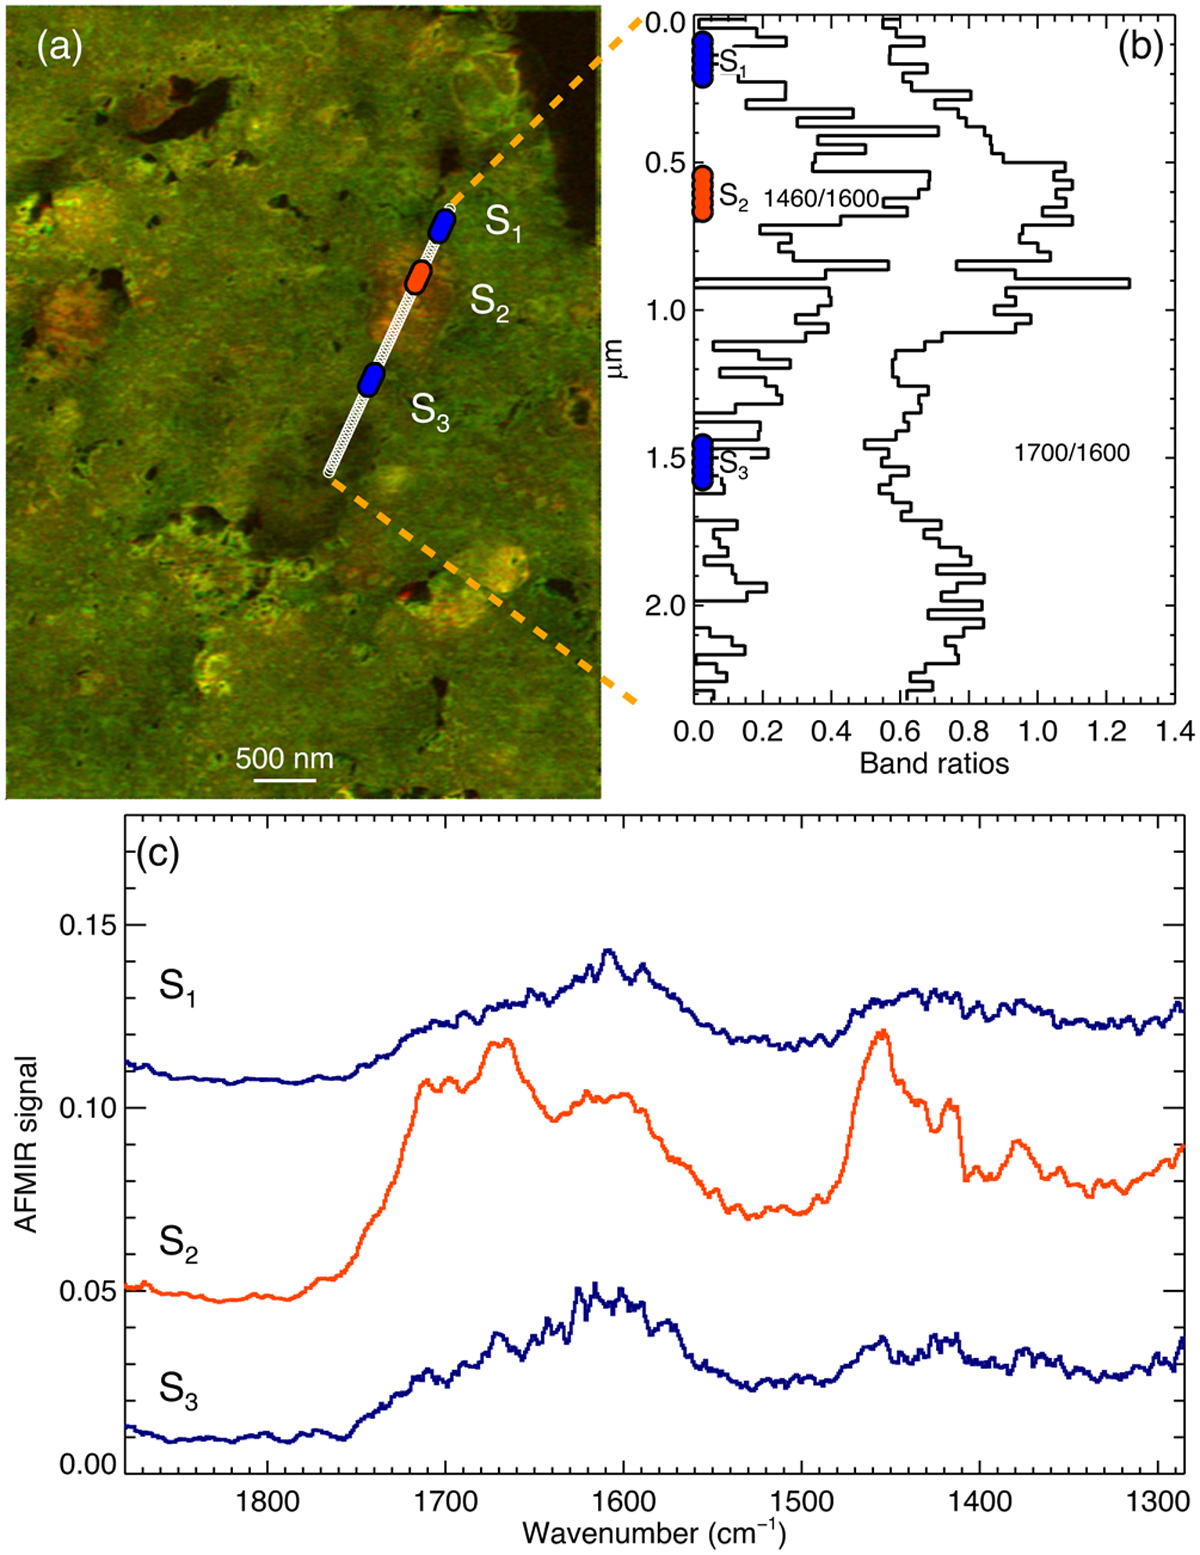
AFM-IR characterization of the Ryugu IOM A0106-IOM residue_3, zoom-in on the organic nanoparticles identified in situ in Fig. 3. (a) RGB image of the region including the organic nanoparticles (C=O at 1720 cm−1 in red, C=C at 1600 cm−1 in green, CHX 1460 cm−1 minus 1520 cm−1) in blue. The white line shows the location of individual AFM-IR spectra taken across one organic nanoparticle. The colored dots (S1 to S3) correspond to the average spectra taken on each side (S1 and S3 in blue) and on the organic nanoparticle (S2 in red). (b) Intensity ratios of frequencies corresponding to CHX/C=C (1460/1600) and C=O/C=C (1700/1600) along the white line shown in (a). The location of the S1 to S3 spectra is recalled on the left axis. (c) Average AFM-IR spectra on each side (blue, S1 and S3) and on the organic nanoparticle (red, S2).
Current usage metrics show cumulative count of Article Views (full-text article views including HTML views, PDF and ePub downloads, according to the available data) and Abstracts Views on Vision4Press platform.
Data correspond to usage on the plateform after 2015. The current usage metrics is available 48-96 hours after online publication and is updated daily on week days.
Initial download of the metrics may take a while.