Fig. 1
Download original image
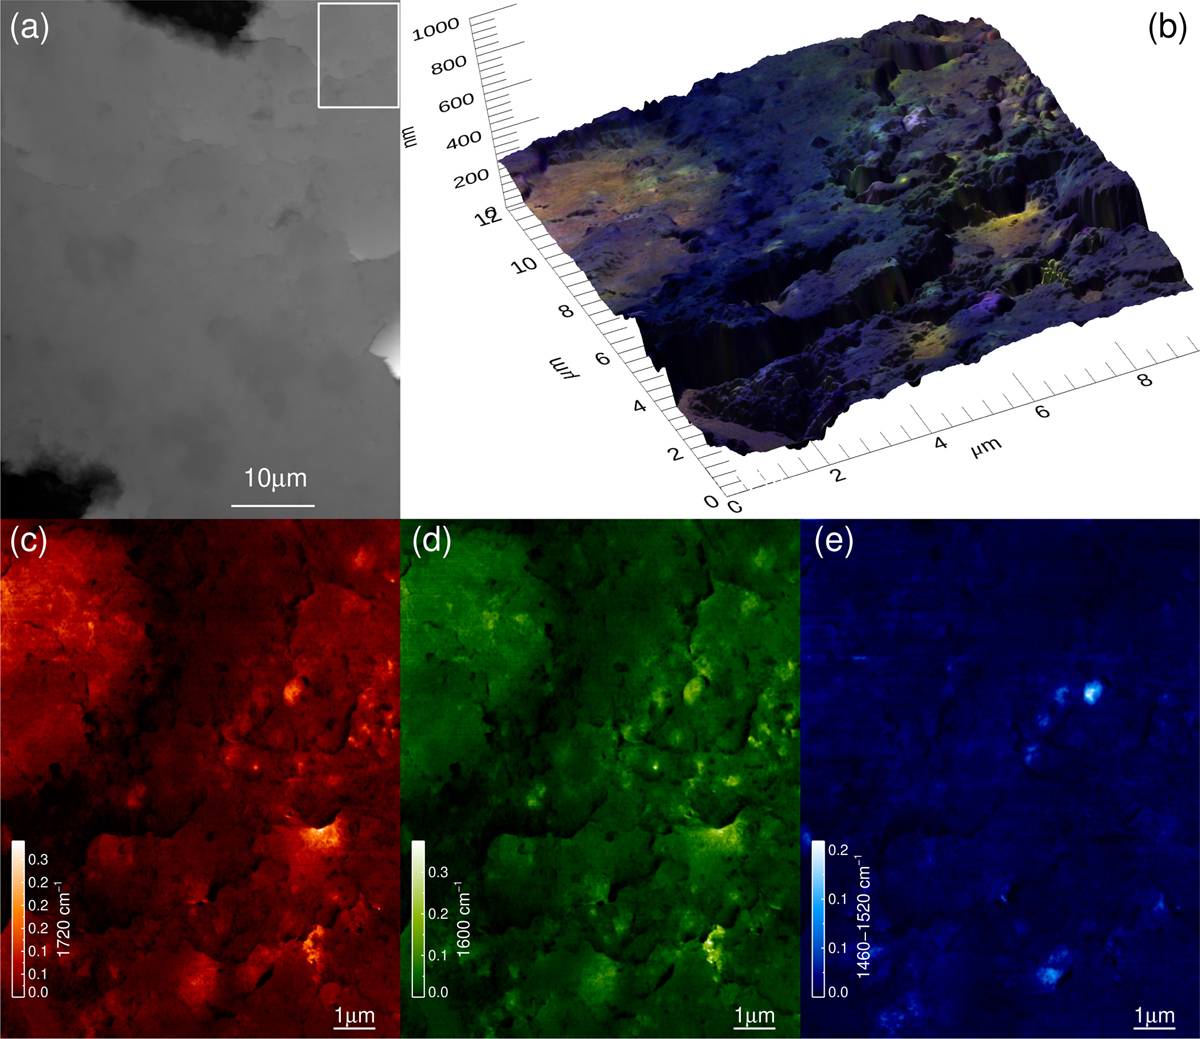
AFM-IR maps of Ryugu A0108-19 whole-rock sample. (a) General large-scale topographic map of the grain. (b) Composite RGB maps (C=O in red, C=C in green, CHX in blue) superimposed on the 3D topographic representation of the sample. (c-e) Individual maps in C=O (in red, at 1720 cm−1), C=C (in green, at 1600 cm−1), CHX (in blue, peaked at 1460 cm−1) used to build the composite RGB image. The CHX deformation modes’ map results from the subtraction of the 1520 cm−1 signal from the 1460 cm−1 signal, in order to suppress the contribution of other vibrational modes’ absorption at 1460 cm−1 (see text for details).
Current usage metrics show cumulative count of Article Views (full-text article views including HTML views, PDF and ePub downloads, according to the available data) and Abstracts Views on Vision4Press platform.
Data correspond to usage on the plateform after 2015. The current usage metrics is available 48-96 hours after online publication and is updated daily on week days.
Initial download of the metrics may take a while.