Fig. 8
Download original image
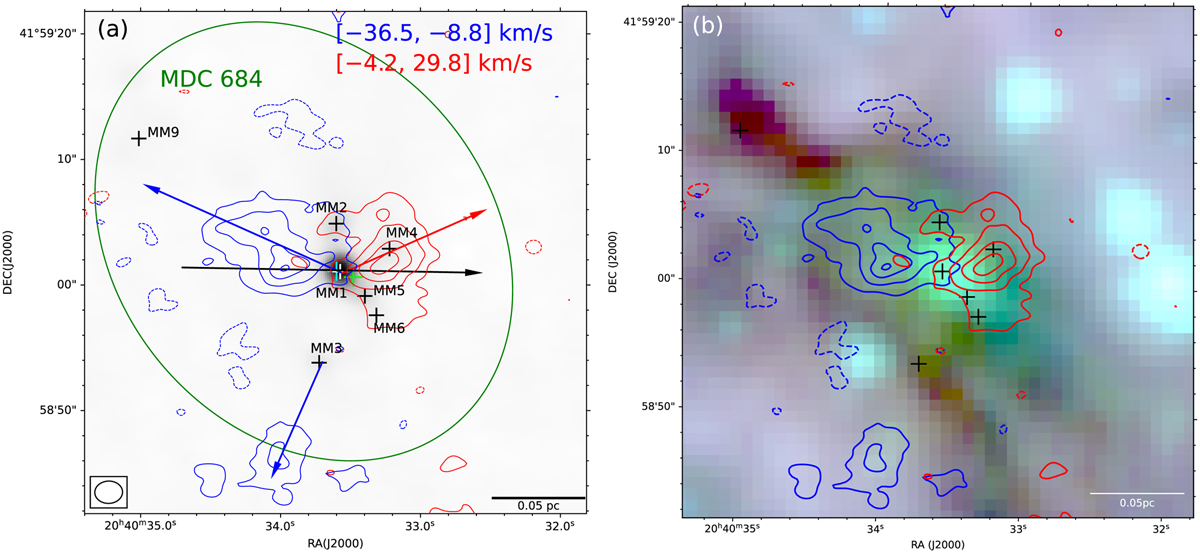
Same convention as Fig. 1 but for MDC684. The blue contour levels are (−3, 3, 6, 9, 12) × σ, with σ = 0.88 Jy beam−1 km s−1, and the red contour levels are (−3, 3, 6, 9, 12) × σ, with σ = 0.78 Jy beam−1 km s−1. (a) The cyan crosses represent water maser spots obtained from the JVLA program 17A-107 (PI: Keping Qiu) and the green cross shows the position of the protostar candidate identified in Kryukova et al. (2014). The black arrow line indicates the PV cut path.
Current usage metrics show cumulative count of Article Views (full-text article views including HTML views, PDF and ePub downloads, according to the available data) and Abstracts Views on Vision4Press platform.
Data correspond to usage on the plateform after 2015. The current usage metrics is available 48-96 hours after online publication and is updated daily on week days.
Initial download of the metrics may take a while.