Fig. B.1
Download original image
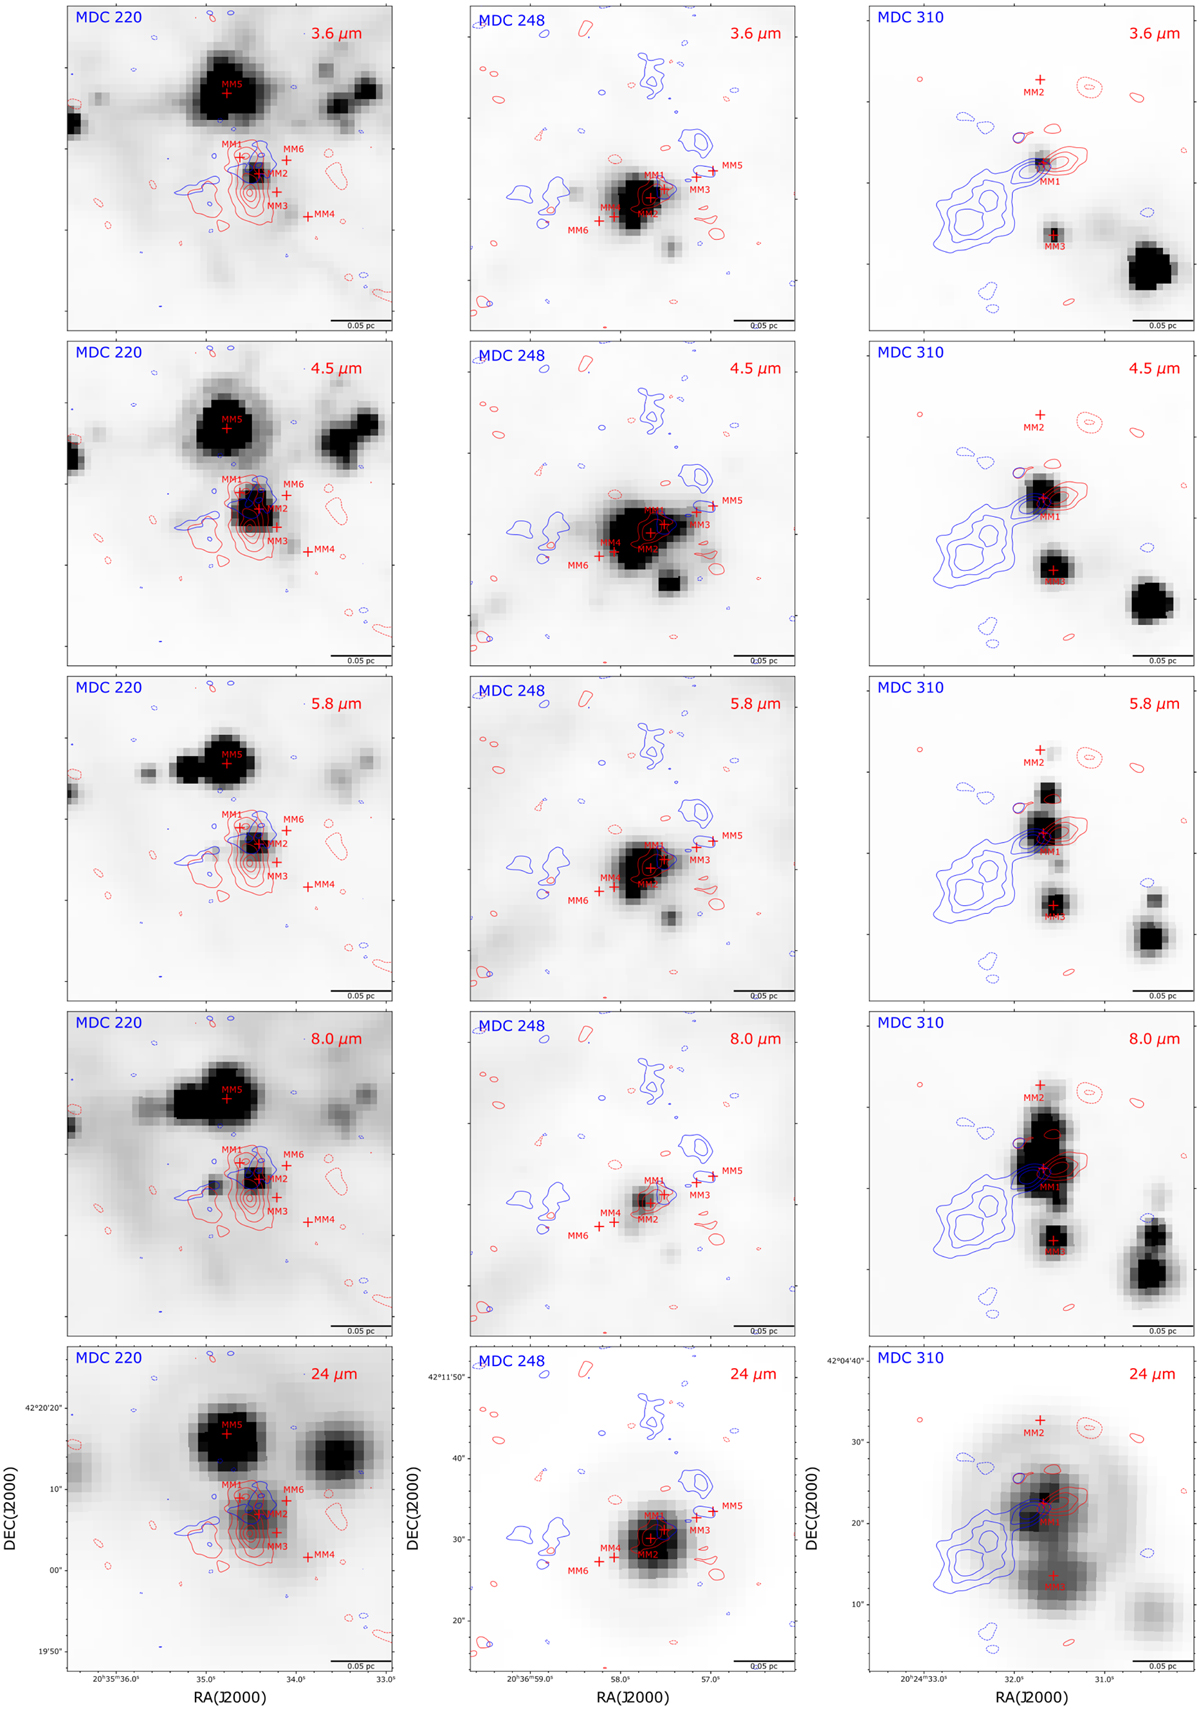
Infrared images of the SiO (5−4)-detected MDCs. From top to bottom, we present the images of Spitzer 3.6/4.5/5.8/8.0/24 μm and from left to right the images are in the region of different MDCs. The red and blue contours are the redshifted and blueshifted SiO (5−4) components with the same levels in Figure 1–15. The red crosses are the positions of identified 1.37 mm continuum sources. The wavelength is marked in the top-right corner. The scale bar is presented in the bottom-right corner.
Current usage metrics show cumulative count of Article Views (full-text article views including HTML views, PDF and ePub downloads, according to the available data) and Abstracts Views on Vision4Press platform.
Data correspond to usage on the plateform after 2015. The current usage metrics is available 48-96 hours after online publication and is updated daily on week days.
Initial download of the metrics may take a while.