Fig. 21
Download original image
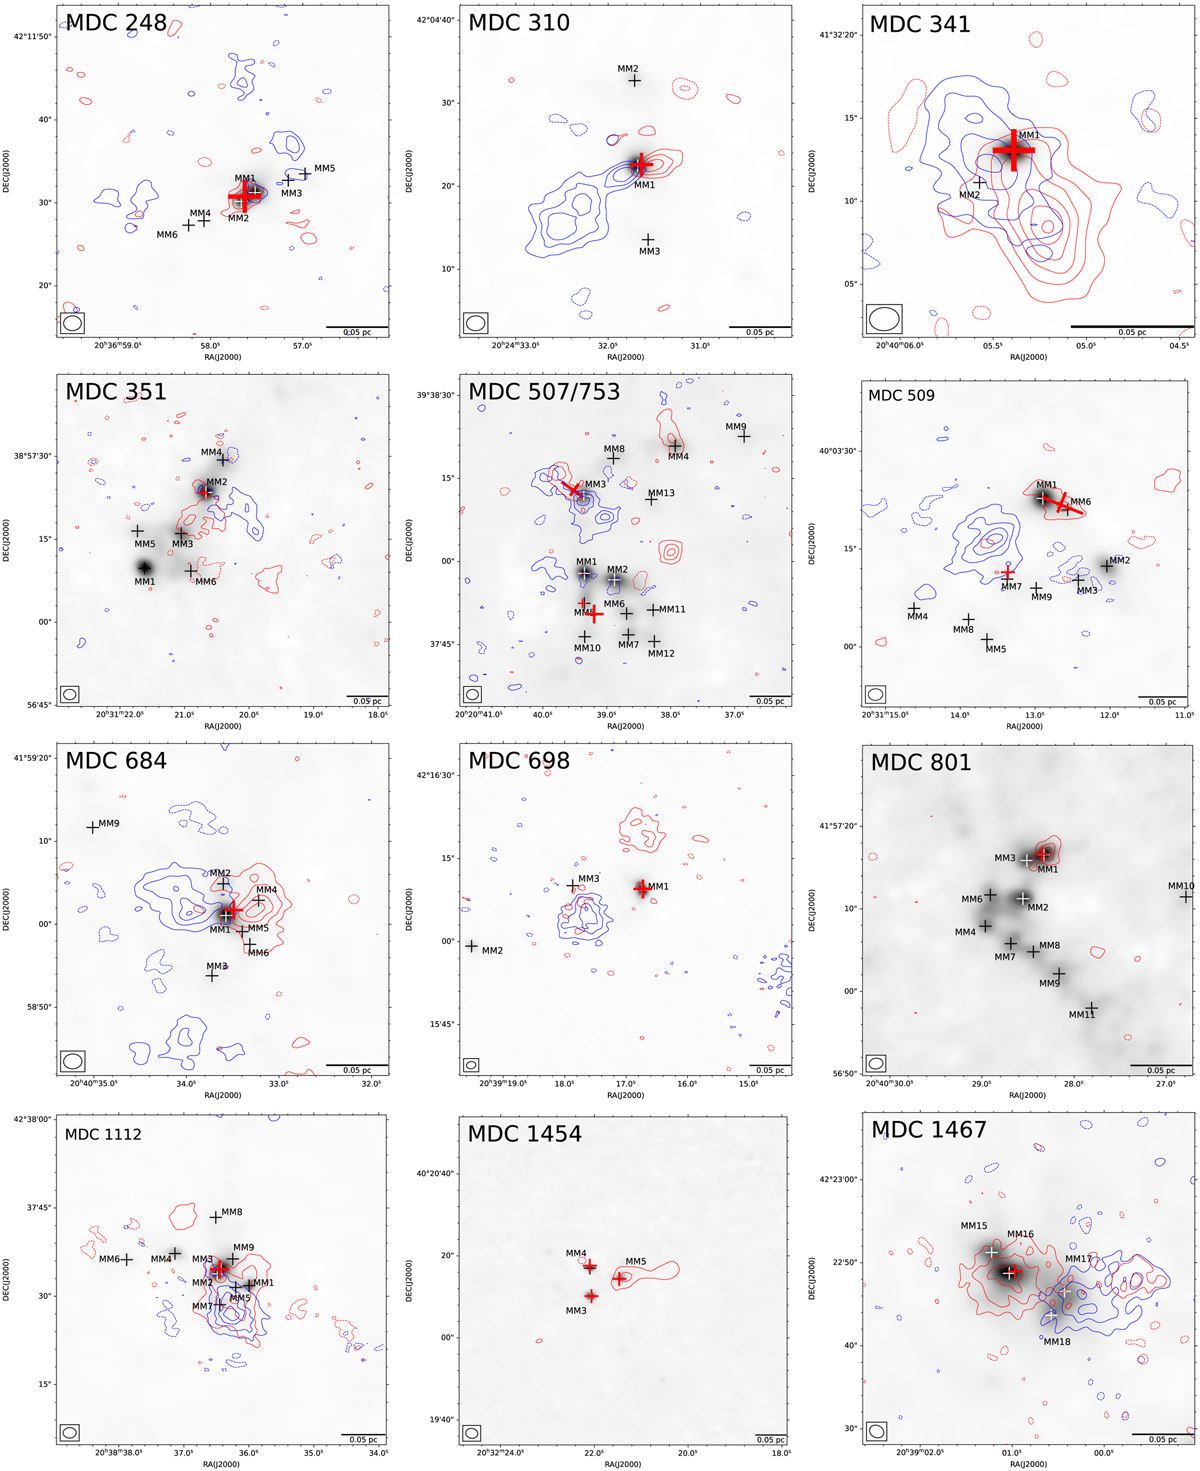
SiO emission versus radio emission associated with 15 continuum sources. The red and blue contours are the redshifted and blueshifted SiO (5–4) components with the same levels in Figs. 1–15. The red crosses represent the positions and spatial scales of radio emissions. The grayscale maps represent 1.37 mm continuum emissions. The black and white crosses represent dust condensations identified by Cao et al. (2021). The MDC ID is marked in the top-left corner. The scale bar is presented at the bottom-right corner.
Current usage metrics show cumulative count of Article Views (full-text article views including HTML views, PDF and ePub downloads, according to the available data) and Abstracts Views on Vision4Press platform.
Data correspond to usage on the plateform after 2015. The current usage metrics is available 48-96 hours after online publication and is updated daily on week days.
Initial download of the metrics may take a while.